
Regression and Correlation Analysis with Table Interpretation
Regression and correlation analysis for research with interpretation of coefficients, R², tables, significance, relationship strength, and model assumptions.

Regression and Correlation Analysis with Table Interpretation
Regression and correlation analysis with table interpretation requires more than extracting a correlation coefficient or reading a significance value from statistical software because correlation and regression answer different questions even though they are closely related. Correlation helps researchers describe the direction and strength of the relationship between specific variables, while regression builds a model that explains how a dependent variable changes in relation to one or more predictors and can be used for explanation or prediction depending on the research design. The analysis therefore begins by identifying the research question, variable types, and expected form of the relationship, followed by checking the data and relevant assumptions. Correlation coefficients, regression coefficients, R², F statistics, and measures of uncertainty are then interpreted carefully. Most importantly, a statistical relationship should not automatically be converted into a causal effect that the study design cannot support.
Regression Analysis for Research
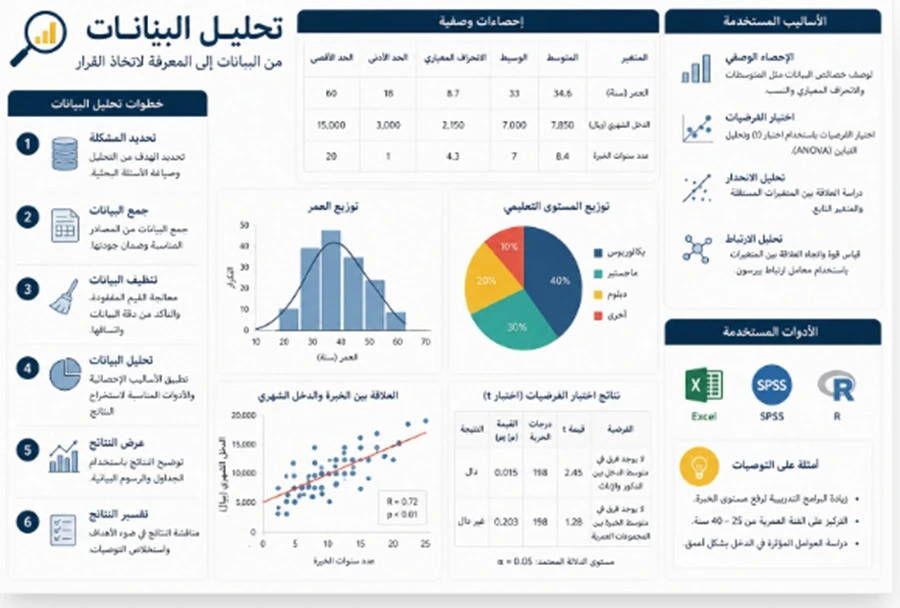
Regression analysis for research begins with a clear question: Which variable do we want to explain or predict, and which variables are expected to be related to it?
In simple linear regression, there is usually one quantitative dependent variable and one independent variable.
Multiple linear regression includes more than one independent variable in the same model to explain variation in the dependent variable.
The purpose is not simply to determine whether X is related to Y.
Regression can estimate how much Y is expected to change when X changes by one unit, while the other variables in a multiple regression model are held constant.
For example, if a researcher studies the relationship between hours of study and academic achievement, regression can estimate how much achievement is expected to change when study time increases.
However, the interpretation remains connected to the model, sample, and research design.
If the study is observational, it is not appropriate to move directly from a regression coefficient to a statement such as “increasing study time caused achievement to improve” without stronger evidence supporting a causal conclusion.
Predictors should also be selected on a theoretical or research basis before the model is constructed.
Adding twenty variables simply because they happen to exist in the dataset does not automatically produce a better model.
Every predictor should have a scientific or theoretical reason for inclusion, especially when the available sample is limited.
The type of dependent variable must also be considered.
Linear regression is suitable for particular situations in which the outcome is quantitative and the model structure is appropriate.
If the dependent variable is binary, such as “passed / did not pass,” another model such as logistic regression may be more appropriate than forcing a linear model onto an unsuitable outcome.
-
Regression begins by identifying the dependent variable and explanatory variables before statistical software is used.
-
Simple and multiple regression answer related but different questions, and the selected model should reflect the research question and data structure.
-
A statistically significant regression coefficient does not automatically establish causation when the research design itself is non-causal.
Correlation Analysis Between Variables
Correlation analysis between variables is used to describe the direction and strength of a relationship between two or more variables according to the type of data and the research question.
For linear relationships, Pearson’s correlation coefficient may be appropriate when the variables are quantitative and the relevant assumptions are reasonably satisfied.
Spearman’s correlation can be more suitable in other situations, including some ordinal data or relationships that are monotonic but do not fit the requirements of Pearson correlation appropriately.
For this reason, Pearson correlation should not be used automatically simply because it is the most familiar coefficient.
A correlation coefficient provides two important pieces of information.
Direction:
A positive value means that the variables tend to move in the same direction.
A negative value means that higher values in one variable tend to be associated with lower values in the other.
Strength:
For Pearson correlation, the closer the absolute value of the coefficient is to 1, the stronger the linear relationship.
A coefficient near zero indicates little or no linear association.
However, a value near zero does not prove that no relationship of any kind exists.
A strong curved or nonlinear relationship may not be represented well by a linear correlation coefficient.
For this reason, visual inspection of the data can be very useful.
It is also inappropriate to apply rigid labels such as “0.30 is weak and 0.50 is moderate” without considering the discipline and research context.
In some research fields, a relatively small relationship may still have meaningful practical implications.
In another context, the same coefficient may be of limited importance.
-
A correlation coefficient describes the strength and direction of a relationship but does not establish that one variable causes the other.
-
The choice between Pearson, Spearman, or another method depends on the variable types, relationship form, and statistical conditions.
-
A weak linear relationship does not rule out the possibility of a meaningful nonlinear pattern that requires a different analytical approach.
Interpreting the Regression Table
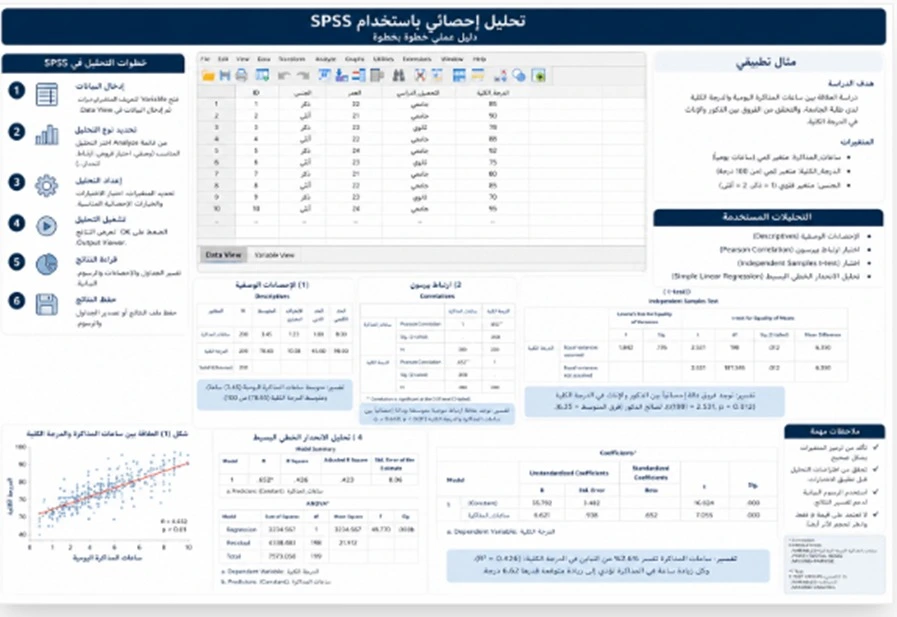
Interpreting the regression table requires reading more than one part of the statistical output because software often distributes information across several tables.
In linear regression, researchers may encounter a model summary table, an analysis of variance table, and a coefficients table.
Each answers a different question.
Model Summary
The model summary commonly includes:
R: This reflects the relationship between observed and predicted values in some regression outputs and is connected to the overall model.
R²: This represents the proportion of variance in the dependent variable explained by the model within the analyzed sample.
If R² = 0.40, the model explains approximately 40% of the observed variance in the dependent variable within the sample and under the specified model.
It does not mean that the predictors “caused 40% of the phenomenon.”
Adjusted R²: This is an adjusted version of R² that accounts more directly for the number of predictors and the sample size.
It is particularly useful when evaluating or comparing some multiple regression models.
ANOVA Table for the Regression Model
The F statistic and its significance test help determine whether the regression model as a whole provides more explanatory information than a model without the predictors under the assumptions of the test.
However, a statistically significant overall model does not mean that every predictor inside it is individually significant.
Coefficients Table
This table commonly contains:
-
The intercept
-
B or the unstandardized regression coefficient
-
Standard error
-
Standardized Beta in some software
-
t statistic
-
p-value
-
Confidence interval in some outputs
-
Multicollinearity indicators such as Tolerance and VIF where requested
Reading the output in this order helps prevent a common error: using R² to answer a question about one individual predictor or using the overall model significance to claim that every predictor is important.
-
R² represents the proportion of variance explained by the overall model within the data and should not be described as a percentage of causal influence.
-
The F statistic concerns the regression model as a whole, while the t statistic for an individual coefficient answers a different question.
-
Regression interpretation requires linking the model summary, overall F test, and coefficients table rather than selecting one number in isolation.
Calculating the Correlation Coefficient
Calculating the correlation coefficient begins before the mathematical calculation itself by examining the structure of the data.
If the researcher intends to use Pearson correlation, it is useful to begin by creating a scatterplot of the two variables.
A scatterplot may reveal information that the coefficient alone cannot show clearly:
-
Is the relationship approximately linear?
-
Are there influential or extreme observations?
-
Do the data appear to form separate groups?
-
Is there a curved relationship?
-
Is the observed range of the variables very restricted?
The appropriate correlation coefficient can then be calculated.
If the coefficient is positive, the researcher can say that higher values of one variable tend to be associated with higher values of the other, according to the type of correlation used.
However, the coefficient alone is not enough.
Sample size, the p-value, and a confidence interval where available should also be considered.
In a very large sample, a small correlation may be statistically significant.
In a small sample, a coefficient that appears moderate may have a very wide confidence interval.
Researchers should therefore distinguish between estimated relationship strength and precision of the estimate.
Restriction of range should also be considered.
If a study includes only students with very high grades, the limited variability in the outcome may change the observed correlation compared with a broader population.
Outliers can also affect the correlation substantially, so they should be examined rather than removed automatically.
-
Correlation analysis should begin with examination of the relationship pattern rather than selecting two columns and calculating a coefficient immediately.
-
Correlation strength, statistical significance, and estimation precision are different pieces of information and should not be treated as interchangeable.
-
An outlier should be diagnosed before exclusion because it may represent a genuine observation.
Analyzing the Relationship Between Two Variables
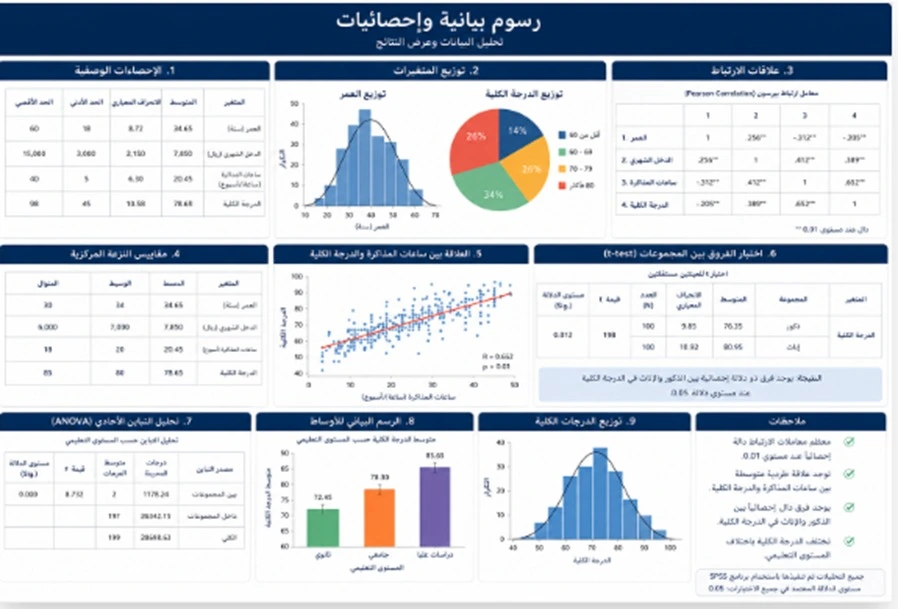
Analyzing the relationship between two variables requires identifying the type of relationship being studied before selecting the appropriate statistic.
If both variables are quantitative, the researcher may be interested in a linear relationship.
If one variable is ordinal or the distribution and relationship structure differ, another method may be more suitable.
If both variables are categorical, traditional Pearson correlation is generally not the appropriate choice at all.
In some situations, the real question is not simply “Is there a relationship?” but rather “How does Y change as X changes?”
Regression may then be more informative because it produces an equation and a slope coefficient that can be interpreted in the units of the variables.
Although simple linear regression and Pearson correlation are mathematically related in important ways, the two methods answer different questions conceptually.
Correlation is largely symmetric: the basic linear correlation between X and Y is the same as the correlation between Y and X.
Regression is directional within the model because the researcher specifies Y as the dependent variable and X as the explanatory variable.
This distinction matters.
A researcher should not say that correlation was used for prediction and then present a regression equation without explaining the analytical change.
Spurious relationships also need to be considered.
Two variables may be correlated because both are related to a third variable.
For example, use of a particular technology may be associated with performance, while age, experience, or organizational type explains part of that association.
Multiple regression can become useful in such situations when the additional predictors have a clear theoretical justification.
-
Analysis of two variables begins with the variable types and the research question rather than with a preselected statistical coefficient.
-
Correlation and regression are related but answer different statistical questions.
-
A third variable may explain part of an observed association, so correlations should not be interpreted separately from the study design and theoretical context.
Linear Regression in Scientific Research
Linear regression in scientific research is used when the research objective is suitable for a linear model and the dependent variable has characteristics that fit that model.
A simple model can be expressed generally as:
Y = b₀ + b₁X + error
Where:
Y is the dependent variable.
b₀ is the intercept.
b₁ is the regression coefficient for X.
If b₁ = 2.5, for example, this may mean, depending on the units and model, that a one-unit increase in X is associated with an expected increase of 2.5 units in Y.
For multiple regression:
Y = b₀ + b₁X₁ + b₂X₂ + ... + error
Each coefficient is interpreted while the other variables included in the model are held constant.
This point is extremely important.
The coefficient for X₁ in a multiple regression model is not necessarily the same as the simple or raw relationship between X₁ and Y.
Instead, it reflects the relationship after accounting for the other included predictors according to the model.
A common mistake is to include predictors that are extremely highly correlated with one another and then interpret each coefficient as though every predictor contributes independently.
This is where multicollinearity becomes important.
Residual analysis is also a central part of evaluating the suitability of the model because clear patterns in residuals may indicate that the linear model has failed to capture important structure in the data.
-
Regression coefficients should be interpreted in the original units while accounting for the other predictors in a multiple regression model.
-
R² alone is not sufficient to judge model quality because residuals, assumptions, and individual coefficients also need to be examined.
-
Linear regression has specific conditions and should not be forced onto an unsuitable dependent variable merely because it is easy to run.
Interpreting Regression Coefficients
Interpreting regression coefficients requires distinguishing between unstandardized and standardized coefficients.
Unstandardized B Coefficient
This coefficient can be interpreted in the original measurement units.
For example, if B = 1.8 for training hours and the dependent variable is a performance score, the interpretation may be:
“After controlling for the other variables in the model, each additional hour of training is associated with an expected increase of 1.8 points in the performance score.”
The final wording depends on the study design.
In an observational study, wording such as “is associated with” or “is linked to an expected change” is usually more appropriate than “causes.”
Standardized Beta
Standardized Beta places variables on a standardized scale and can be useful in some contexts for comparing coefficients.
However, using Beta alone to rank predictors from “most important” to “least important” requires caution.
Importance depends on model structure, variability, intercorrelations among predictors, and the theoretical role of each variable.
Intercept
The intercept represents the expected value of Y when all predictors equal zero.
However, this interpretation may not have practical meaning if zero falls outside the observed range.
For example, if all participants are between 18 and 25 years old, the predicted outcome at age zero may have no substantive interpretation.
p-Value for the Coefficient
This provides evidence related to whether the coefficient differs from zero under the statistical model.
It does not by itself describe practical importance.
Confidence Interval
A confidence interval provides a range of plausible values for the coefficient under the statistical framework and gives more information about uncertainty than a single point estimate.
-
B is interpreted in the original units of the variables, while Beta is standardized and serves a different analytical purpose.
-
The intercept may have little practical meaning even though it is an important mathematical part of the model.
-
Coefficient size, statistical significance, and confidence intervals provide different types of information and should be interpreted together.
Testing the Strength of a Statistical Relationship
Testing the strength of a statistical relationship means examining the magnitude of the relationship itself rather than asking only whether statistical significance was reached.
In correlation analysis, the value of r directly describes the direction and magnitude of the linear relationship.
However, the meaning of the magnitude depends on the research field.
A value of 0.20 may seem limited in one context but could still have practical importance in behavioral or social research depending on the nature of the variables.
In regression, the p-value should not be used to determine how “strong” the model is.
Instead, researchers may examine indicators such as:
-
R²
-
Adjusted R²
-
Magnitude of regression coefficients
-
Precision of the estimates
-
Model performance
-
Residuals
-
Other model-specific statistics appropriate for the analysis
If the purpose of the model is prediction, performance on the same dataset used to build the model may appear better than its performance on new observations.
In more advanced predictive applications, validation procedures or independent datasets may therefore be needed.
Researchers should also avoid statements such as “the relationship is strong because it is statistically significant.”
Strength and significance are not the same thing.
A weak relationship can be statistically significant in a large sample.
A moderate relationship may fail to reach significance in a small sample because the estimate is imprecise.
-
Relationship strength should be evaluated through coefficient magnitude and appropriate model indicators rather than through the p-value alone.
-
Sample size affects statistical significance, so “significant” does not automatically mean “strong.”
-
Regression model quality requires several indicators including model fit, interpretation, and residual diagnostics rather than R² alone.
Explaining Correlation Tables

Explaining correlation tables requires reading the intersections between variables without repeating every number in a way that overwhelms the reader.
In a correlation matrix, variables appear in both the rows and columns.
The value at the intersection of two variables is the correlation coefficient between them.
The main diagonal usually contains the correlation of each variable with itself, which equals 1.
For Pearson correlations, the matrix is symmetric, meaning the correlation of X with Y is the same as the correlation of Y with X.
When reporting the findings, the researcher does not need to explain every cell if the table contains many variables.
It is usually better to focus on relationships connected directly to the research questions or hypotheses.
For example:
“The results showed a positive association between X and Y, with a correlation coefficient of (...) and a significance value of (...). This indicates that higher values of X were associated with higher values of Y within the sample.”
The strength of the relationship can then be interpreted in the context of the discipline without describing it as causal.
When several predictors are included, very high correlations between them deserve attention before they are entered into a multiple regression model.
However, pairwise correlation alone does not fully diagnose multicollinearity.
Indicators such as VIF and Tolerance can also be reviewed within the regression model.
-
Correlation tables should be interpreted according to the research questions rather than describing every value without a clear purpose.
-
Positive and negative correlations describe the direction of shared variation and do not establish causality.
-
High correlations among predictors should prompt a multicollinearity review before multiple regression coefficients are interpreted.
Analyzing the Effects of Research Variables
The phrase analyzing the effects of research variables requires careful use because the word “effect” can imply a stronger causal conclusion than the research design allows.
If the study is a well-designed randomized experiment, causal interpretation may have stronger support.
If the study is based on a cross-sectional questionnaire, however, regression generally describes conditional associations, explanatory patterns, or predictive relationships within the data rather than proving direct causation.
For example, if academic stress has a positive and statistically significant coefficient in a model predicting exhaustion, it may be appropriate to state that higher academic stress was associated with a higher expected exhaustion score while the other variables in the model were held constant.
The statement “academic stress causes exhaustion by a certain percentage” would usually go beyond what regression alone demonstrates.
R² should also not be described as the “percentage effect of the variables.”
It represents the proportion of variance explained by the model within the analyzed data.
In multiple regression, researchers should also distinguish between the statistical significance of the overall model and the significance of individual predictors.
The model may be statistically significant even though some predictors are not significant after the others are included.
The reverse pattern can also occur when comparing simple and adjusted relationships.
A variable may be significantly correlated with the outcome on its own but become non-significant in multiple regression because other predictors explain overlapping information.
This is not necessarily a contradiction.
It reflects the difference between a raw relationship and a relationship conditioned on the other variables in the model.
-
The word “effect” should not be used causally unless the design and methodology support causal inference.
-
R² represents explained variance and should not be interpreted as a percentage of direct causal influence.
-
A predictor may be associated with the outcome alone but change in magnitude or significance after other predictors enter the model because the meaning of a multiple regression coefficient is different from a simple association.
What Is the Difference Between Correlation and Regression?
The main difference is that correlation describes a relationship, while regression builds a directional model around a dependent variable.
Understanding this distinction prevents researchers from using the two terms as though they were interchangeable.
How Do We Read R, R², and Adjusted R²?
R, R², and Adjusted R² have different roles.
In simple regression, R and R² have a direct mathematical relationship with the simple correlation coefficient.
In multiple regression, R reflects the relationship between the observed outcome and the outcome predicted from the complete set of predictors.
R² represents the proportion of variation in the dependent variable explained by the model within the analyzed data.
If R² = 0.55, the model explains 55% of the observed variation in Y within the sample and under the specified model.
It should not be written that the predictors are “causally responsible for 55%” of the outcome.
Adjusted R² adjusts the estimate to account more directly for the number of predictors and sample size.
Adding another predictor can increase R² even when that predictor contributes very little, whereas Adjusted R² may remain unchanged or decrease.
For this reason, both values can be useful when interpreting multiple regression models.
How Do We Read the ANOVA Table in Regression?
The ANOVA table in regression separates variation into the part explained by the model and the part left in the residuals.
The F statistic evaluates the overall statistical significance of the regression model under the selected framework.
If the result is statistically significant, the predictor set as a whole provides information about the dependent variable beyond a reference model with no predictors.
However, the F statistic does not identify which predictor is important.
For that question, the researcher needs to move to the coefficients table.
A statistically significant F test also does not prove that the model is practically strong.
A model can be statistically significant but still explain very little variance in a large sample.
For this reason, overall significance should be interpreted together with model fit and diagnostic information.
How Do We Read the Coefficients Table?
The coefficients table is often the part that confuses students most.
It can be read in the following order:
-
Variable name.
-
B to understand the direction and magnitude of expected change.
-
Standard error to understand the precision of the coefficient.
-
Beta where reported and relevant.
-
t statistic.
-
p-value.
-
Confidence interval.
-
VIF and Tolerance in multiple regression where available.
If B is positive, the conditional association is positive.
If B is negative, the conditional association is negative.
If the p-value is sufficiently small according to the selected analysis criterion, the data provide statistical evidence against a zero coefficient within the model.
However, if the confidence interval is very wide, the magnitude of the coefficient may still be estimated imprecisely.
If VIF is concerningly high, multicollinearity should be examined before coefficients are interpreted directly.
What Is Multicollinearity and Why Does It Matter?
Multicollinearity occurs when independent variables in a regression model contain a large amount of overlapping information.
The problem is not that predictors must be completely uncorrelated.
Some relationship between predictors is normal in many research studies.
The problem arises when the overlap becomes strong enough to make individual coefficient estimates unstable or difficult to separate from one another.
Indicators that may be examined include:
-
Very high correlations among predictors
-
VIF
-
Tolerance
-
Large changes in coefficients when variables are added or removed
-
Large standard errors
There is no single universal cutoff that perfectly diagnoses every case without context.
The appropriate response depends on the theoretical and statistical reason for the multicollinearity rather than automatically deleting a predictor because one indicator exceeds a particular number.
Checking Regression Assumptions Before Interpreting Tables
Before treating regression coefficients as ready for interpretation, the relevant assumptions of the model should be reviewed.
For classical linear regression, important considerations can include:
-
Appropriate linear form of the modeled relationship
-
Independence of errors according to the study design
-
Homogeneity of residual variance
-
Distributional behavior of residuals where relevant for inference
-
Absence of excessively influential observations
-
Absence of severe multicollinearity in multiple regression
-
Appropriate model specification and inclusion of relevant variables
Residual analysis is particularly important because visible patterns in residuals can indicate that the selected model has not adequately captured the structure of the data.
For this reason, a researcher should not jump directly from the coefficients table to the final conclusion without reviewing model quality.
Common Errors in Regression and Correlation Analysis
Common problems in university research include:
-
Using Pearson correlation without examining the form of the relationship
-
Treating every significant correlation as strong
-
Converting correlation into causation
-
Using linear regression with an unsuitable dependent variable
-
Entering many predictors without theoretical justification
-
Failing to inspect residuals
-
Ignoring heteroscedasticity
-
Ignoring multicollinearity
-
Interpreting R² as a causal percentage
-
Using Beta alone to rank predictor “importance”
-
Ignoring the unstandardized B coefficient
-
Failing to explain the unit of change in the predictor
-
Relying on p-values without confidence intervals or coefficient magnitude
-
Calling a model excellent simply because it is statistically significant
-
Assuming a predictor is completely unimportant because it is non-significant in one model
-
Using a regression equation for predictions far outside the observed data range
-
Deleting outliers only because they reduce R²
-
Ignoring the difference between simple relationships and adjusted relationships
-
Copying complete statistical-software output directly into the thesis
-
Writing an interpretation that does not match the sign of the coefficient
Correcting these errors is more important than increasing the number of regression models.
A Simple Example of Regression Table Interpretation
Consider the following educational example only:
X1 could be interpreted as follows:
A one-unit increase in X1 is associated with an expected increase of 1.50 units in Y while X2 is held constant.
The coefficient for X2 is negative.
This means that a one-unit increase in X2 is associated with an expected decrease of 0.60 units in Y while X1 is held constant.
These values are only educational examples and should never be copied into a real thesis.
Actual interpretation depends on the variable names, units, research design, and model assumptions.
How Should a Correlation Result Be Written in a Thesis?
Instead of writing:
“There is a relationship because Sig is below 0.05.”
A stronger formulation is:
“The analysis showed a positive association between (...) and (...), with a correlation coefficient of (...) and a significance value of (...). The finding indicates that higher values of (...) were associated with higher values of (...) within the sample, without treating the observed relationship as independent evidence of causation.”
If the correlation is negative:
“The results showed a negative association between (...) and (...).”
The coefficient magnitude can then be interpreted according to the scientific context.
How Should a Regression Result Be Written in a Thesis?
A clear reporting order can be used:
-
Was the overall model statistically significant?
-
How much variation did the model explain?
-
Which predictors had interpretable coefficients?
-
What was the direction of each coefficient?
-
What was the expected magnitude of change?
-
What are the limits of interpretation?
A general formulation may be:
“The regression model showed that the included predictors explained (...) of the variance in the dependent variable according to R², and the overall model was (...) according to the F test. After controlling for the remaining predictors, the variable (...) was associated with an expected increase/decrease of (...) in the dependent variable.”
The p-value, confidence interval, and other required indicators can then be reported according to university guidelines and the selected analysis.
Why Shouldn't We Always Choose the Model with the Highest R²?
Because R² can increase when new predictors are added even when those predictors contribute little meaningful information.
The strongest model is not necessarily the model containing the largest number of variables.
Researchers need to balance:
-
Theoretical justification
-
Model simplicity
-
Adjusted R²
-
Precision of coefficients
-
Statistical assumptions
-
Interpretability
-
Predictive performance where prediction is the objective
-
Avoidance of overfitting
If a researcher adds twenty predictors only to increase R², the model may perform well on the current sample while performing poorly on new data.
Correlation, Regression, and Causality: What Is the Difference?
These three concepts should not be confused.
Correlation: Two variables change together in a statistical pattern.
Regression: A model describes or predicts a dependent variable using one or more other variables.
Causality: A claim that changing X produces a change in Y.
Causal conclusions require stronger research design and reasoning than a correlation or regression coefficient alone.
Even when a regression coefficient is highly statistically significant, omitted variables, bias, reverse relationships, or design limitations may still prevent a causal conclusion.
Why Choose Rukn for Regression and Correlation Analysis?
At Rukn Translation and Educational Services, the analytical scope can be defined according to the actual research question rather than applying the same model to every dataset.
A researcher may only need a correlation between two variables.
Another may require a correlation matrix involving several variables.
A different study may require simple linear regression.
Research involving several predictors may need multiple regression together with multicollinearity and residual diagnostics.
In other cases, the problem may not be running the statistical analysis at all but interpreting the tables accurately inside the thesis.
The practical value lies in connecting every statistical table to the research question it answers.
R² should not be presented as a causal percentage.
A predictor should not be described as statistically significant before its coefficient has been interpreted correctly within the model.
A statistically significant relationship or regression model should also never be guaranteed in advance because the result depends on the actual data.
The researcher remains responsible for the collection of the data, the design of the study, the final selection of variables, and the submission of the results under their name.
Steps for Regression and Correlation Analysis in Research
The work can be organized through the following stages:
-
Receive the research plan and research questions or hypotheses.
-
Review the variables and identify dependent and independent variables or the variables whose relationship will be examined.
-
Identify the type and measurement level of each variable.
-
Review the dataset and check coding and missing values.
-
Explore and describe the data visually and statistically before constructing the model.
-
Select the appropriate correlation coefficient when the research question concerns association.
-
Select the appropriate type of regression when the question concerns explanation or prediction.
-
Check the assumptions of the selected analysis.
-
Review outliers and influential observations without automatic deletion.
-
Check multicollinearity when the model includes several predictors.
-
Run the analysis and extract the essential indicators.
-
Review R, R², and Adjusted R² according to the model.
-
Read the F test for the overall regression model.
-
Interpret B, Beta, t, p-values, and confidence intervals for the coefficients.
-
Inspect residuals and check for clear patterns that may indicate model problems.
-
Organize correlation or regression tables appropriately for the thesis.
-
Write the findings in accurate research language without confusing association with causation.
-
Match the tables with the written interpretation and research questions before submission.
Following these steps gives every value in the statistical output a clear function instead of turning software output into pages of unexplained numbers.
Regression and Correlation Analysis Prices
There is no single fixed price for regression and correlation analysis with table interpretation because the analytical scope differs from one study to another.
Factors that can affect the scope include:
-
Number of variables
-
Sample size
-
Type of dependent variable
-
Number of predictors
-
Whether correlation alone is required
-
Whether simple or multiple regression is required
-
Need for logistic regression or another type of model
-
Condition of the dataset
-
Amount of missing data
-
Need to check model assumptions
-
Presence of multicollinearity
-
Number of models to be compared
-
Number of result tables
-
Need for coefficient interpretation
-
Need to review the results chapter
-
Supervisor revisions
-
Submission deadline
A correlation analysis between two variables in a clean dataset is different from a multiple regression model containing several predictors and requiring residual diagnostics, multicollinearity checks, and model comparison.
For this reason, it is better to provide the research questions, hypotheses, dataset, variable definitions, scale-scoring method, and supervisor comments where available so the analytical scope can be determined before pricing.
Frequently Asked Questions
What is the difference between correlation and regression?
Correlation describes the direction and strength of the relationship between variables, while regression defines a dependent variable and builds a model to explain or predict it using one or more predictors. Neither method proves causation by itself.
Does a high R² mean the regression model is excellent?
Not necessarily. R² describes the amount of variance explained by the model, but model quality also requires examination of assumptions, residuals, coefficients, scientific meaning, and generalizability.
Is every statistically significant correlation a strong relationship?
No. Statistical significance is affected by sample size, while strength is reflected by the magnitude of the correlation coefficient and its context. A small coefficient may still be statistically significant in a large sample.
Is Beta the same as B in a regression table?
No. B is an unstandardized coefficient interpreted in the original units of the variables, while Beta is standardized and can serve different purposes such as comparing coefficients on a common scale, with caution when interpreting “importance.”
What should I send when requesting regression or correlation analysis?
Send the research plan, research questions or hypotheses, dataset, variable definitions, scale-scoring method, and any supervisor or university requirements.
Conclusion
Successful regression and correlation analysis with table interpretation is not measured by the number of statistically significant relationships or by obtaining the highest possible R².
Strong analysis begins with a clear research question.
The researcher then identifies the variable types and the expected form of the relationship.
The appropriate correlation coefficient or regression model is selected.
The data, statistical assumptions, and residuals are examined.
Direction, strength, explained variance, and uncertainty are then considered.
In regression, the significance of the overall model should be interpreted separately from the significance of individual coefficients, while B, Beta, R², and confidence intervals should each be interpreted according to their actual purpose.
Most importantly, the researcher should not transform correlation into causation, R² into a “percentage of effect,” or a p-value into a measure of relationship strength.
The final objective is to reach a relationship or statistical model that can be interpreted clearly within the limits of the data and the study design.
If you already have research data and questions involving relationships between variables or prediction of a dependent outcome, prepare the research plan, dataset, variable definitions, and any supervisor comments, then contact Rukn Translation and Educational Services to determine whether you need correlation analysis, simple regression, multiple regression, model-assumption review, or interpretation of statistical tables and coefficients before including them in the thesis.
Need Help?
Contact us directly via WhatsApp and we will reply as soon as possible.
More Articles
Online Saudi Math Tutor by School Stage and Curriculum
Online Saudi math tutoring tailored to the student’s school stage and level, from foundations and lesson explanation to problem solving and exam review.
Read Article → Statistical AnalysisStatistical Results Interpretation and Research Results Chapter Review
Statistical results interpretation and results chapter review with clear table explanations, significance reporting, research-question alignment, and accurate academic presentation.
Read Article → Research Project AnalysisProfessional Project Dashboard Design in Spreadsheets
Professional project dashboard design with KPIs, charts, filters, interactive reports, and visual tracking to monitor results, progress, and project performance.
Read Article →