
Research Data Cleaning in Spreadsheets Before Statistical Analysis
Research data cleaning before analysis, including missing values, duplicates, errors, outliers, spreadsheet organization, and accurate database preparation.
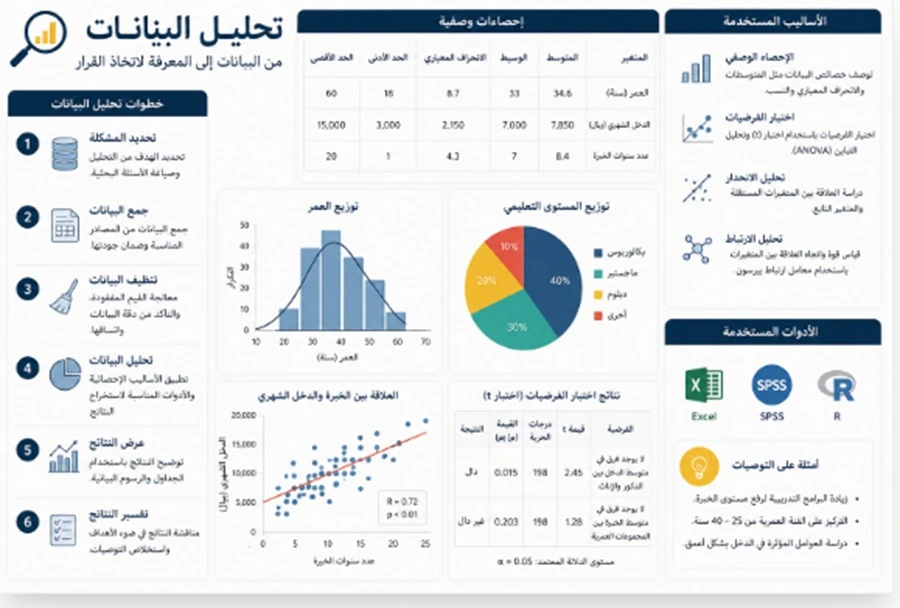
Research Data Cleaning in Spreadsheets Before Statistical Analysis
Research data cleaning in spreadsheets before statistical analysis should begin before any statistical test is performed because the accuracy of means, relationships, differences, and regression models depends first on the quality of the data stored in the file. An empty cell may represent a missing response or a question that did not apply to the participant. A duplicated row may be an accidental copy or a genuine second submission. A value far from the rest of the data may be a data-entry error or a valid observation that should not be deleted automatically. Good data cleaning therefore does not mean changing the dataset until it looks neat. It means identifying errors and inconsistencies, documenting decisions, preserving the original raw file, and creating a separate working version that is organized and traceable. Only after these steps should the research dataset move into statistical software for analysis with greater confidence.
Cleaning Research Data
Cleaning research data means reviewing the dataset systematically to identify problems that may affect the analysis or cause the researcher to interpret information differently from what was actually collected.
The first important rule is not to begin by editing the original file.
It is preferable to preserve a raw version exactly as it was exported from an electronic questionnaire or entered from paper forms and then create a separate copy for cleaning.
This separation is extremely important.
If the researcher discovers several days later that a value was changed incorrectly, the raw file provides a reference for checking what the original response actually was.
If the original file itself has been modified without a backup, distinguishing original responses from later changes may become difficult.
The general review can then begin.
How many rows are present?
Does each row represent one participant?
Does the number of cases approximately match the expected number of responses?
Are all expected columns available?
Are the variable names understandable?
Are there merged cells?
Are there empty columns or technical fields that are not relevant to the statistical analysis?
The values should then be reviewed.
If an age variable is expected to contain reasonable ages for the study population and the value 222 appears, that value requires investigation.
If a response scale ranges from 1 to 5 and a value of 8 appears, there is probably a data-entry or coding problem.
However, the researcher should not correct the value by guessing.
The original source or response record should be checked whenever possible.
-
Preserve the raw dataset without modification and create a separate version for cleaning.
-
Important changes should ideally be documented rather than modifying values silently.
-
Range checks and frequency reviews are among the simplest methods for detecting data-entry problems early.
Handling Missing Values
Handling missing values is one of the most sensitive parts of data cleaning because an empty cell does not always have the same meaning.
A participant may have intentionally left a question unanswered.
The question may not have appeared because of questionnaire skip logic.
A value may have been lost during data transfer.
The response may exist in the original questionnaire but may have been missed during manual entry.
These situations are different.
Before considering imputation or deletion, the researcher should first determine how much data are missing and where the missing values occur.
Are missing values distributed across many questions?
Or does one particular variable contain a high proportion of missing responses?
Did a particular group of participants leave the same question unanswered?
Could the missingness be related to how the question was displayed?
Spreadsheet filters can be used to identify blank cells and review them.
Simple counting formulas can also help determine the number of available and missing values in each column.
A common error is automatically replacing every missing value with the column mean.
This decision can change the distribution, reduce variability, and influence relationships among variables.
The appropriate method for handling missing values depends on the reason for the missingness, its amount, the variable type, and the statistical analysis planned later.
Using zero to represent missing data also requires caution when zero is a possible legitimate value.
Missing data should be clearly distinguishable from real responses and should not enter calculations as though they were genuine observations.
-
An empty cell does not always represent the same type of missingness, so its cause should be identified whenever possible.
-
Missing values should not automatically be replaced with the mean or another constant without statistical justification.
-
A missing-data code should be clearly different from every legitimate value that can occur in the variable.
Correcting Data Errors
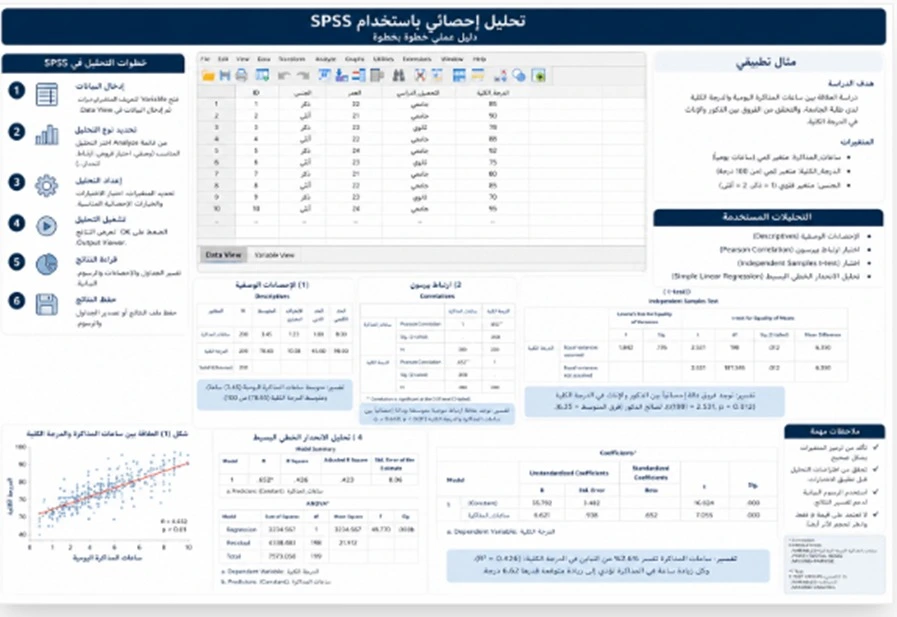
Correcting data errors involves identifying values that were entered or transferred differently from the original response.
Some errors can be very simple.
For example, entering 55 instead of 5.
Or entering 21 instead of 12.
Or storing “Male ” with an extra space so the spreadsheet treats it as a different category from “Male.”
Other errors can be more complicated.
A date may be entered as day/month/year in some rows and month/day/year in others.
A number may be stored as text in some cells and as a genuine numeric value in others.
Spreadsheets may display such values similarly even though they are stored differently, and this problem may appear later during sorting, calculations, or statistical import.
Data types should therefore be standardized.
Numbers should be stored as numbers.
Dates should use a consistent format.
Text categories should be reviewed for spaces, spelling differences, and unintended variations.
However, correction should always be evidence-based.
If the value 71 appears in the age column while most students are between 18 and 25, the researcher should not automatically change it to 17 because it “looks like the digits were reversed.”
The original source should be checked when available.
If the correct value cannot be confirmed, the problem should be documented and handled according to the research plan rather than inventing a replacement value.
-
Clear errors should be corrected by checking the original source whenever possible.
-
Similar text values should be standardized only when they genuinely represent the same category.
-
An unusual value should not be changed into a more “logical” number based on assumption alone.
Preparing Spreadsheets for Statistical Analysis
Preparing spreadsheets for statistical analysis means creating a structure that can be read easily and imported reliably into statistical software.
In a common survey-data structure, each row represents one participant or case and each column represents one variable.
This format makes the dataset easier to review and transfer into statistical analysis programs.
It is generally useful to avoid:
-
Merged cells inside the data area.
-
More than one header row for the same variable.
-
Empty rows between participants.
-
Notes written inside cells that are supposed to contain variable values.
-
Combining several different variables in one column.
-
Storing several responses in one cell without a clear coding strategy.
For example, if the researcher has age, specialization, gender, and twenty questionnaire items, each element should normally have its own column.
Administrative notes can be stored in another worksheet or in a clearly labeled field that will not be included in the statistical analysis.
Column names should also be concise, organized, and unique.
A name such as Q1 can be acceptable if the researcher has a data dictionary explaining the full question.
However, having three columns all labeled “Score” creates problems during import and review.
The first row should contain the variable names only, with the actual data beginning immediately below.
This type of organization reduces confusion and helps statistical software recognize the dataset correctly.
-
Each column should represent one defined variable and each row should represent one case in most survey datasets.
-
Formatting elements that interfere with import, such as merged cells and unnecessary blank rows, should be removed.
-
Variable names should be unique, understandable, and connected to a data dictionary.
Removing Duplicate Research Data
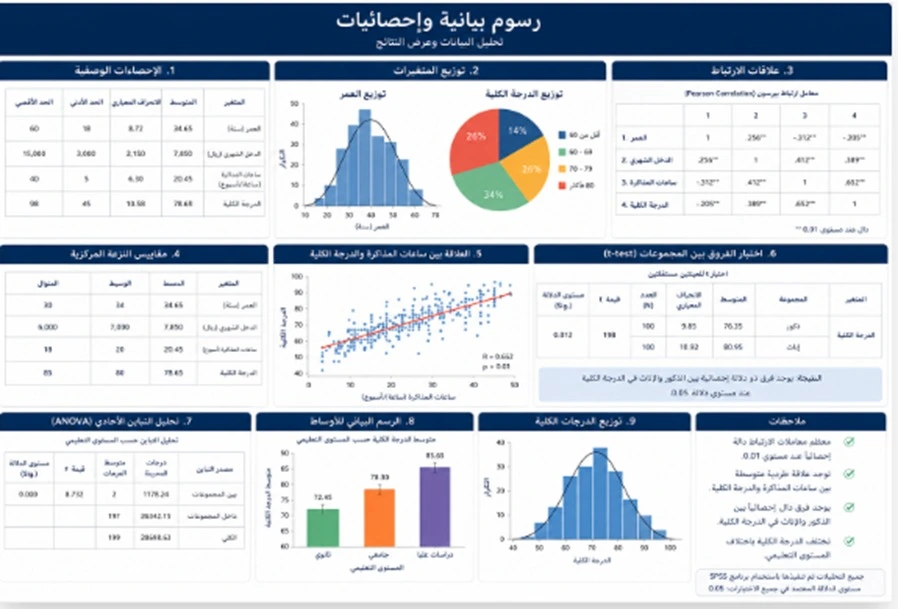
Removing duplicate research data requires more than clicking a spreadsheet command labeled “Remove Duplicates.”
Two identical rows may represent a genuine duplicate.
However, they may also represent two different participants who happened to provide identical answers.
This is especially possible in short questionnaires.
The researcher therefore needs to know which fields can reasonably be used to identify a duplicate.
If there is a unique response identifier, it can be reviewed.
If the electronic form records submission time, the timestamp may help when combined with other information.
Relying only on identical answers can lead to deletion of legitimate participants.
If the same identifier appears twice, the reason should be investigated.
Did the participant submit the questionnaire twice?
Was the first submission incomplete and the second complete?
Does the research protocol specify that only the most recent response should be kept?
These are methodological decisions and should be handled consistently.
In manually entered data, duplication may occur because the same questionnaire was entered twice.
The questionnaire number or internal identifier can then be compared with the paper source.
A temporary duplicate-checking column, conditional formatting, or filters can help identify possible duplicates, but final deletion should only occur after verification.
-
Similar or identical rows are not sufficient evidence by themselves that a case is duplicated.
-
Unique identifiers, submission time, and original sources can help verify duplicate responses.
-
The reason for deleting a duplicate case should be documented so the final sample size remains explainable.
Reviewing Outliers
Reviewing outliers means identifying values that appear substantially different from the rest of the dataset and then determining whether they represent errors or genuine observations.
For example, if most values for a variable fall between 40 and 80 but a value of 400 appears, that observation deserves investigation.
However, the word “outlier” does not automatically mean “wrong.”
An extreme value may result from a coding or data-entry error.
It may also be a valid observation carrying important information.
Within a spreadsheet, the researcher can begin with simple tools such as:
-
Sorting values from lowest to highest.
-
Checking minimum and maximum values.
-
Reviewing quartiles.
-
Creating a boxplot if supported.
-
Plotting the data.
-
Comparing the value with the original source.
Statistical rules such as the interquartile range or standardized scores can also be used to flag potential outliers in some situations.
However, being flagged by a statistical rule does not automatically justify deletion.
If the value results from a confirmed data-entry error, it should be corrected.
If the value is accurate and possible, it may be retained or its influence may be evaluated using an appropriate analytical approach.
If the researcher decides to exclude it, the decision should follow a defensible and documented criterion.
-
Outliers should be identified and investigated rather than automatically deleted.
-
Sorting, plots, minimums, and maximums are useful tools for initial screening.
-
Decisions to retain or exclude an observation should depend on the reason for the value and the research design, not on whether deletion improves the statistical result.
Organizing Survey Data in Spreadsheets

Organizing survey data in spreadsheets requires converting responses into a database structure that is easy to audit before any statistical analysis is performed.
The process begins by assigning a clear identity to every column.
For example:
-
ID
-
Age
-
Gender
-
Specialization
-
Q1
-
Q2
-
Q3
-
Dimension1_Score
-
Dimension2_Score
If the questionnaire contains multiple-response questions, the storage structure should be clear.
A question such as “Select all options that apply” may require several columns, with each option represented by a variable indicating whether it was selected.
Writing “WhatsApp, Email, Platform” in one cell may be convenient for raw storage, but it requires additional preparation before statistical analysis.
Open-ended responses should remain in separate text columns.
If they are categorized later, it is preferable to retain the original text alongside the coded category rather than replacing it completely.
When organizing survey data in spreadsheets, the researcher should also avoid using color alone to represent important information.
For example, a red row should not mean “excluded” and a green row “included” unless there is also a variable explicitly recording the case status.
Colors may not transfer into statistical software.
A variable such as “Case_Status” or a separate exclusion log is more reliable.
The spelling of categories should also remain consistent.
If the specialization is “Business Administration,” it should not appear in some rows as “Business Admin,” others as “Administration,” and others as “BA” unless those categories intentionally represent different groups.
-
Data meaning should be stored in variables and values rather than in colors alone.
-
Multiple-response questions require a structure that allows each selected option to be analyzed clearly.
-
Original open-ended text should be retained even when an analytical category or code is created.
Formatting the Study Database
Formatting the study database is different from visually formatting a presentation spreadsheet.
The purpose is not to choose attractive colors or fonts.
The purpose is to create a stable and understandable file that can be transferred into statistical software without losing meaning.
It may be useful to divide the workbook into functional worksheets where appropriate.
For example:
Raw:
The original unmodified data.
Clean:
The cleaned dataset.
Dictionary:
Variable definitions and coding rules.
Log:
Important changes and cleaning decisions.
Checks:
Temporary formulas and quality-control procedures.
This separation helps prevent the original data from becoming mixed with formulas, checks, and later transformations.
In the final dataset, calculated formulas may sometimes need to be converted to values before export, while a separate version containing the original formulas should be retained for review.
Decimal separators and date formats also require attention when moving files between programs or devices with different regional settings.
For example, the value 1.5 may be represented differently depending on local spreadsheet settings.
The exported file should therefore be checked rather than assuming all values transferred correctly.
Unnecessary personally identifying information should also be minimized in the analysis version.
If names and phone numbers have no analytical purpose, they should generally not remain in the analysis file where the research design, university requirements, and ethical procedures allow their removal.
-
Database formatting focuses on stability and reviewability rather than visual appearance alone.
-
Separating Raw, Clean, Dictionary, and Log worksheets can reduce version-control and copying errors.
-
The analysis version should contain only the information necessary for the research, consistent with the study plan and privacy requirements.
Auditing Data Before Analysis

Auditing data before analysis is the final stage for making sure that a problem discovered later in the statistical results did not originate from an error in the spreadsheet.
The final audit should occur at several levels.
Checking the Number of Cases
How many responses were collected?
How many cases exist in the raw file?
How many remain after cleaning?
If the number changes, the reason should be documented.
Checking Value Ranges
Every variable has an expected range.
A scale from 1 to 5 should not contain 6 or 15.
A binary question should not contain a third category unless that category was part of the design.
Checking Logical Consistency
If a participant answered “I have never used the service,” does it make sense for that participant to have several detailed answers about service usage?
If a participant is below the minimum age required for the sample, how was the case included?
Checking Scale Dimensions
Are all correct items included?
Was the reverse-coded item handled according to the scoring method?
Does the calculated dimension score use the correct items only?
Checking Data Types
Is age stored as a number?
Are dates genuinely stored as dates?
Are missing values defined appropriately?
Manual Spot Checking
Selecting a number of rows and comparing them with the original source can reveal errors that filters do not detect.
Finally, the cleaned version should be saved with a clear filename and date rather than relying on names such as “Final Final Version 3.”
-
The final number of cases should be traceable from the raw dataset to the analysis file.
-
Logical consistency across columns is as important as checking each individual column.
-
The final exported file should be opened and reviewed before being imported into statistical software.
Processing Raw Research Data
Processing raw research data includes all decisions that transform the original file into an organized analytical dataset without changing the truth of what was collected.
Processing may include:
-
Removing technical columns that are not required for analysis.
-
Naming variables.
-
Standardizing categories.
-
Correcting verified data-entry errors.
-
Identifying missing values.
-
Detecting duplicate records.
-
Reviewing outliers.
-
Creating derived variables.
-
Calculating scale or dimension scores where appropriate.
-
Creating an exclusion log.
-
Preparing an import-ready file.
However, processing does not include inventing an answer for a participant.
It does not include changing a response because the researcher considers it “illogical.”
It does not include deleting participants so a hypothesis becomes statistically significant.
It does not include recategorizing variables after seeing the results simply to improve the statistical tables.
The cleaned dataset should continue to represent the data that were actually collected.
For this reason, maintaining a data-cleaning log can be extremely useful.
For example:
A cleaning log makes the process reviewable rather than leaving behind a series of unexplained modifications.
What Is the Difference Between Data Cleaning and Data Coding?
The two stages are connected, but they are not the same.
Coding defines what values mean.
Cleaning asks whether the values actually stored in the dataset are correct, consistent, and usable.
Spreadsheet Data Cleaning Checklist
Before moving into statistical analysis, the researcher can review the following checklist.
File Structure
-
Every row represents one case.
-
Every column represents one variable.
-
Column names are not duplicated.
-
No merged cells exist within the data area.
-
Unnecessary blank rows are removed.
-
Unused columns are identified.
Data Quality
-
Every variable falls within the correct range.
-
Categories use consistent spelling.
-
Numbers are stored as numeric values.
-
Dates follow a consistent format.
-
No undefined codes remain.
-
Reverse-coded items are known.
Missing Values
-
The amount of missing data in each variable is known.
-
Missing data are different from zero when zero is a valid value.
-
Logically skipped questions are distinguished where possible.
-
Missing values have not been replaced arbitrarily.
Duplicates
-
Unique identifiers have been checked.
-
Potential duplicate records have been reviewed.
-
No row has been deleted merely because the answers look similar.
-
Reasons for deletion are documented.
Unusual Values
-
Minimum and maximum values have been checked.
-
Sorting and plots have been used where useful.
-
Potential outliers have been investigated.
-
Values have not been deleted merely to improve the findings.
Final Dataset
-
The raw file has been preserved.
-
The cleaned file has been saved under a different name.
-
The data dictionary has been updated.
-
A cleaning log exists where necessary.
-
The exported version has been opened and reviewed.
-
The final number of cases is known.
Using Filters and Data Validation During Cleaning
Filters are among the simplest and most useful spreadsheet tools for data cleaning.
They can help display:
-
Blank cells.
-
A particular value.
-
Different categories.
-
Highest and lowest values.
-
Cases with a particular exclusion status.
Data validation is especially useful during manual entry or before further data collection.
If an item only permits values from 1 to 5, the spreadsheet can be configured to reduce the chance of entering values outside that range.
However, data validation does not replace final auditing.
Users may paste data in ways that bypass some restrictions, and the original source itself may already contain a problem.
Conditional formatting can also help identify:
-
Potential duplicates.
-
High or low values.
-
Blank cells.
-
Values meeting a particular condition.
However, the color is only a review aid and should not become the only way information is stored in the final dataset.
How Should Inconsistent Text Values Be Reviewed?
A common problem is having one category written in several different forms.
For example:
-
Riyadh
-
Riyad
-
RIYADH
-
Riyadh with an extra trailing space
If these values genuinely represent the same category, they can be standardized.
However, the researcher should first make sure the differences are not intentional.
Useful spreadsheet tools include:
-
Sorting.
-
Reviewing unique values.
-
Filters.
-
Removing unnecessary spaces.
-
Search and replace used carefully.
Bulk search-and-replace commands can create new errors when one term is part of another value, so the result should always be checked after replacement.
Should Rows with Missing Values Be Deleted Completely?
Not as a general rule.
One missing value does not automatically make all information from that participant unusable.
The decision depends on:
-
Amount of missing data.
-
Which variables are missing.
-
Type of statistical analysis.
-
Instrument rules.
-
Research plan.
-
Reason for the missing value.
Some analyses can use available information in particular ways.
Other analyses may require complete values for a specified set of variables.
Automatically deleting every row containing one blank cell can therefore remove a large amount of useful data without justification.
Should Outliers Be Deleted from the Spreadsheet?
They should not be deleted automatically.
An outlier should pass through three questions.
Is it an error?
If yes, and the correct value can be confirmed, it should be corrected.
Is it valid but rare?
It will often be retained or its influence examined.
Does it have a strong influence on the analysis?
Its impact should be evaluated using an appropriate method rather than deleting it simply because the result changes.
The key principle is to understand why the observation is unusual before deciding what to do with it.
Why Do We Need Both Raw and Clean Files?
The raw file protects the history of the data.
The clean file is used for working and analysis preparation.
If the researcher keeps only the cleaned dataset, it may become difficult to determine whether a particular value was original or later modified.
Maintaining both allows comparison.
A practical structure is:
Raw: Never modified.
Clean: Contains documented cleaning changes.
Analysis: Ready for statistical procedures and may contain derived variables.
This prevents original responses from becoming mixed with scores or transformations created later.
Common Errors During Research Data Cleaning
Errors that can affect statistical analysis include:
-
Editing the raw dataset directly.
-
Deleting incomplete rows without understanding the reason for missingness.
-
Replacing all missing values with the mean.
-
Deleting all outliers automatically.
-
Assuming every pair of identical rows represents one participant.
-
Combining genuinely different categories by mistake.
-
Using colors as though they were actual data.
-
Leaving numbers stored as text.
-
Mixing formulas and fixed values inconsistently across rows.
-
Using inconsistent date formats.
-
Entering notes inside numeric variable columns.
-
Leaving unnecessary spaces in category labels.
-
Using several missing-value codes without documentation.
-
Losing the original file after cleaning.
-
Removing participants because their responses do not support the researcher’s expectations.
-
Failing to document why cases were excluded.
-
Keeping unnecessary identifying information in the analysis file.
-
Exporting the file without reviewing it afterward.
-
Failing to compare the final number of cases with the original count.
-
Beginning statistical analysis before completing data-quality checks.
Why Choose Rukn for Research Data Cleaning and Preparation?
At Rukn Translation and Educational Services, the scope of data preparation can be defined according to the actual condition of the research file before statistical analysis begins.
A researcher may have a dataset exported directly from an electronic questionnaire that only needs category standardization and missing-value review.
Another dataset may have been entered manually and therefore require more extensive checking for transcription errors.
In another case, the main problems may involve duplicate records, date formats, or numerical values stored as text.
A spreadsheet may also look organized visually while still containing out-of-range values or dimension scores calculated from the wrong columns.
For this reason, the work should begin by understanding the questionnaire and research plan rather than simply deleting blank cells.
Data cleaning should never be presented as a way to “improve the results.”
Its purpose is to improve the accuracy with which the dataset represents the information that was actually collected.
Participant responses should not be changed and cases should not be removed merely because they influence the mean or hypothesis result.
Steps for Cleaning Data Before Statistical Analysis
The work can be organized through the following stages:
-
Receive the dataset and the final questionnaire or research instrument.
-
Preserve a separate raw copy before any changes are made.
-
Review the number of rows and columns against the original data source.
-
Identify the purpose of every column and create or update the data dictionary.
-
Standardize variable and category names without changing their meaning.
-
Check data types such as numeric, text, and date formats.
-
Review missing values and examine their location and pattern.
-
Check the valid range for every variable.
-
Detect potential duplicates and verify them before deletion.
-
Review unusual values and outliers using sorting, plots, and appropriate methods.
-
Check logical consistency across variables.
-
Review reverse-coded items and scale scores where applicable.
-
Create a log of important changes and exclusions.
-
Remove elements that interfere with statistical import, such as merged cells and unnecessary rows.
-
Create a clearly named Clean version.
-
Create an Analysis version where needed containing derived variables.
-
Manually compare a sample of rows with the original source.
-
Review the file after export or format conversion.
-
Confirm the final number of cases and variables.
-
Prepare a dataset ready for the statistical analysis stage with the main cleaning decisions clearly documented.
Following these steps allows the researcher to understand what changed in the file and why instead of receiving a “clean” spreadsheet without knowing how it was modified.
Research Data Cleaning Prices
There is no single fixed price for research data cleaning in spreadsheets before statistical analysis because the workload depends on the condition and complexity of the dataset.
Factors that can affect the scope include:
-
Number of participants.
-
Number of variables.
-
Number of worksheets.
-
Whether data were collected electronically or entered manually.
-
Amount of missing data.
-
Number of text categories.
-
Presence of duplicate records.
-
Number of unusual values.
-
Need to return to original questionnaires.
-
Presence of multiple-response questions.
-
Presence of open-ended questions.
-
Need to create a data dictionary.
-
Presence of reverse-coded items.
-
Need to calculate dimension scores.
-
Number of logical consistency rules to be checked.
-
Presence of several data sources.
-
Need to merge multiple files.
-
Need for a version prepared for SPSS or another statistical program.
-
Submission deadline.
A file containing 100 well-organized electronic responses is different from several spreadsheets collected from different sources that require merging, standardization, and extensive review.
For this reason, it is better to provide the dataset, final questionnaire, coding rules, and any supervisor comments so the cleaning scope can be identified before pricing.
Frequently Asked Questions
Does data cleaning mean deleting unusual values?
No. Data cleaning means investigating the value and determining why it appears unusual. If it is a confirmed error, it can be corrected. If it is a genuine observation, it should not be deleted automatically simply because it differs from the rest.
Can I replace every missing value with the mean?
Not as a general rule. Missing-data treatment depends on the reason for missingness, its amount, variable type, and planned analysis. Automatically replacing missing values with the mean can alter important characteristics of the dataset.
Are similar rows always duplicates?
No. Two different participants can provide identical answers. A unique identifier or other reliable information should be reviewed before any case is removed as a duplicate.
Do I still need to clean a file exported directly from an online form?
Yes. Electronic export reduces some manual-entry errors, but it does not eliminate missing values, duplicate submissions, inconsistent text categories, logical inconsistencies, or unusual observations that require review before analysis.
What should I send when requesting research data cleaning?
Send the current dataset, final version of the questionnaire or research instrument, variable definitions, current coding method, scoring rules for dimensions where applicable, and any supervisor comments.
Conclusion
Successful research data cleaning in spreadsheets before statistical analysis is not measured by the number of rows deleted or by how attractive the spreadsheet looks.
The real objective is to create a dataset that represents the original information as accurately as possible.
The process begins by preserving the raw version.
The spreadsheet structure is then reviewed.
Missing values are examined.
Verified data-entry errors are corrected.
Potential duplicates are investigated instead of automatically deleted.
Outliers are reviewed without assuming that unusual means incorrect.
Categories, formats, and data types are standardized.
The number of cases and variables is then audited, and a documented clean dataset is created for analysis.
Every minute spent identifying a problem before statistical analysis can prevent that problem from affecting a mean, correlation, regression model, or hypothesis test later.
Clean data therefore do not mean “perfect” data.
They mean data that are understandable, consistent, documented, and faithful to what was actually collected.
If you already have a research dataset or questionnaire responses stored in a spreadsheet and the file needs review before statistical analysis, prepare the dataset, final research instrument, coding method, and any supervisor comments, then contact Rukn Translation and Educational Services to determine whether you need cleaning of missing values, duplicates, and errors only or complete preparation of the research database before moving into statistical analysis.
Need Help?
Contact us directly via WhatsApp and we will reply as soon as possible.
More Articles
Online Saudi Math Tutor by School Stage and Curriculum
Online Saudi math tutoring tailored to the student’s school stage and level, from foundations and lesson explanation to problem solving and exam review.
Read Article → Statistical AnalysisStatistical Results Interpretation and Research Results Chapter Review
Statistical results interpretation and results chapter review with clear table explanations, significance reporting, research-question alignment, and accurate academic presentation.
Read Article → Research Project AnalysisProfessional Project Dashboard Design in Spreadsheets
Professional project dashboard design with KPIs, charts, filters, interactive reports, and visual tracking to monitor results, progress, and project performance.
Read Article →