
Research Hypothesis Testing and Choosing the Right Statistical Test
Research hypothesis testing and statistical test selection based on variable type and study design, with accurate interpretation of significance, effect size, and results.

Research Hypothesis Testing and Choosing the Right Statistical Test
Research hypothesis testing and choosing the right statistical test requires much more than searching statistical software output for a value below 0.05. The correct test begins with the research question, the type of variables, the number of groups, the structure of the measurements, and the assumptions of the statistical model. A researcher may obtain a statistically significant result from an inappropriate test, making the analytical method itself problematic before interpretation even begins. For this reason, the process starts by reviewing the hypothesis and translating it into a testable form, identifying the variables and their measurement levels, selecting an appropriate analysis, and checking its assumptions. The significance value is then interpreted together with the magnitude of the difference, strength of the relationship, effect size, and confidence interval where appropriate. The objective is not to make the hypothesis “accepted” by any possible method, but to reach a conclusion genuinely supported by the data and study design.
Statistical Hypothesis Testing in Research
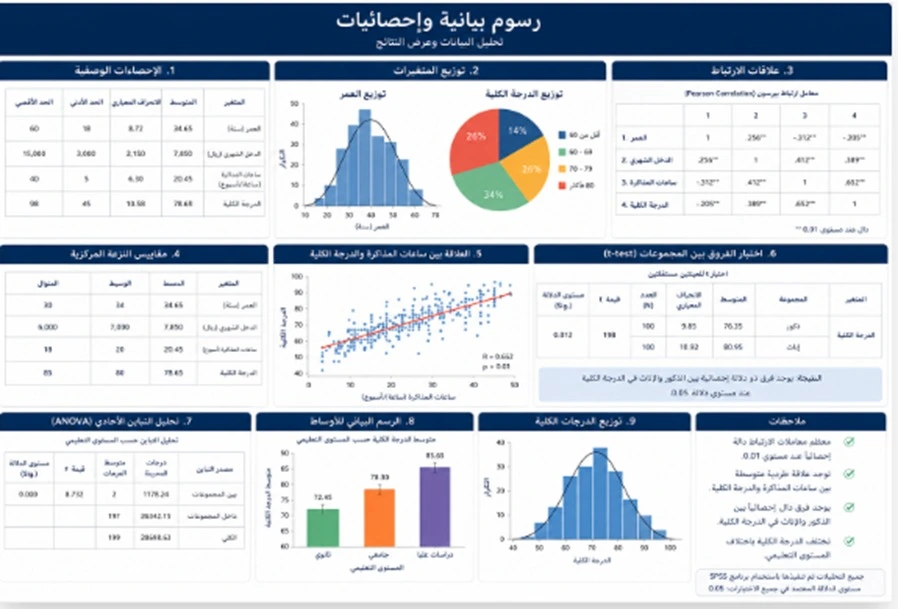
Statistical hypothesis testing in research begins with understanding the hypothesis itself before selecting software or a statistical procedure.
A research hypothesis usually predicts a difference, relationship, effect, or association between specified variables, while the null hypothesis is often formulated as the absence of the particular difference or relationship being tested.
However, the hypothesis must be connected to variables that can actually be measured.
A statement such as “technology is important for students” is too broad and does not identify a clear statistical test.
A statement such as “there are differences in mean satisfaction with online learning according to academic level” is clearer because the researcher can identify the outcome variable and the groups being compared.
Once the hypothesis is defined, the unit of analysis needs to be identified.
Are the observations from independent individuals?
Were the same participants measured twice?
Is the dependent variable quantitative?
Is the main predictor categorical?
These details can completely change which statistical test is appropriate.
It is also important to define the analysis plan before looking at the results whenever possible.
If a researcher tries several tests and several ways of categorizing variables, then reports only the method that produced a significant result, the risk of selective interpretation increases.
A statistical result is stronger when the question and analysis are determined by the logic of the study rather than by a search for a preferred number.
-
A hypothesis should identify measurable variables that can be connected to a clear analysis rather than using broad wording that cannot be tested precisely
-
Determining whether observations are independent or related is essential before selecting a test of differences
-
The strongest analysis plan is based on the research question before the results are examined rather than trying different tests until a significant value appears
Choosing the Appropriate Statistical Test
Choosing the appropriate statistical test depends on a series of connected questions rather than a rule such as “I have a questionnaire, so I should use a particular test.”
The first question is: What is the purpose of the analysis?
Does the researcher only want to describe the data?
Do they want to compare two groups?
Are three or more groups being compared?
Is the purpose to examine a relationship between two variables?
Does the researcher want to predict the value of one variable using several predictors?
Is the question about an association between two categorical variables?
The next step is identifying the type of variables.
A nominal variable such as academic specialization or region is different from a quantitative variable such as age or a total scale score.
The number of groups and the structure of the measurements should then be identified.
Comparing the mean scores of two independent groups is different from comparing the same participants before and after an intervention.
Likewise, comparing three groups is different from comparing two.
The assumptions of the analysis also matter.
Parametric procedures have assumptions that vary according to the test and model, such as independence of observations, distributional characteristics, or homogeneity of variance in some situations.
If a parametric procedure is not appropriate, another method or a nonparametric alternative may be more suitable.
However, a nonparametric test should not be treated as an automatic solution for every dataset that appears non-normal. The researcher still needs to consider the variable type, research question, and actual structure of the data.
A simplified decision table can help:
This table is only a starting point and does not replace a full review of the research design and the assumptions of each method.
-
Statistical test selection begins with the research question and variable types rather than the name of the software being used
-
The number of groups and whether measurements are independent or related can change the appropriate test even when the outcome variable is the same
-
The appropriate test is the one that answers the research question while respecting the characteristics of the data and assumptions of the statistical model
Analyzing Study Hypotheses
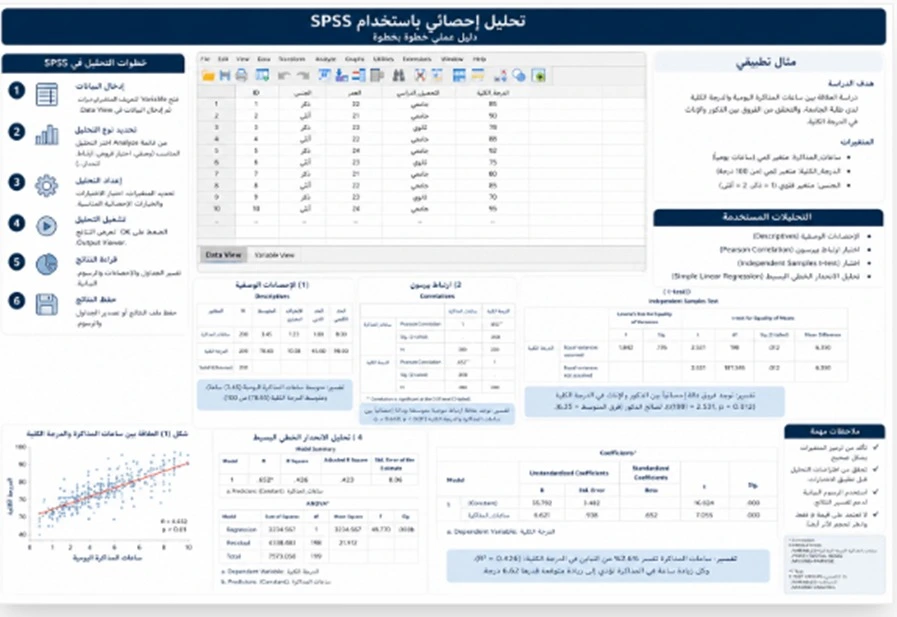
Analyzing study hypotheses requires converting every hypothesis into a clear analytical plan before the results are generated.
An internal planning table can include:
-
Hypothesis number
-
Hypothesis wording
-
Independent variable
-
Dependent variable
-
Type of each variable
-
Number of groups
-
Required analysis
-
Relevant assumptions
-
Statistics that will be reported
For example, if a hypothesis proposes differences in satisfaction according to type of academic program, the researcher needs to know how many program categories exist, whether satisfaction is treated as a quantitative score, and how that score was constructed.
If another hypothesis examines the relationship between academic anxiety and academic achievement, the analysis will be different because the question concerns association rather than group differences.
In some theses, the researcher may write five hypotheses but produce seventeen statistical tests in the final results.
That may be justified if planned subgroup or secondary analyses were included, but the reason should be transparent.
Running a large number of tests without a clear rationale and reporting only significant results weakens the transparency of the study.
The researcher should also consider the issue of multiple testing.
As the number of independent tests increases, the probability of obtaining apparently significant findings by chance can also increase, which means some designs may require procedures or strategies that address multiplicity according to the analysis plan.
It is also important to distinguish between primary and exploratory analyses.
Primary analyses answer the predefined hypotheses.
Exploratory analyses can still be useful, but they should be described clearly as additional analyses rather than being presented as though they were specified from the beginning.
-
Every hypothesis should have a clear map linking it to the variables analysis method and final result table
-
Additional tests should have a transparent reason rather than being performed in large numbers with only significant findings retained
-
Planned and exploratory analyses should be distinguished so the reporting remains transparent and methodologically defensible
Testing Differences Between Variables
The phrase testing differences between variables is used frequently, although researchers often actually mean testing differences between groups or measurements on a specific dependent variable.
Before selecting the procedure, several questions should be answered.
How many groups are involved?
Are the groups independent?
Are the measurements from the same individuals?
What is the nature of the dependent variable?
For example, comparing mean scores for two independent groups is different from comparing the same participants before and after an intervention.
When three or more groups are involved, repeatedly conducting separate two-group tests can increase the problem of multiple comparisons, so an overall test across groups may be more appropriate before detailed pairwise comparisons.
The magnitude of the difference should also be examined.
Suppose one group has a mean of 75.2 and another has a mean of 75.8.
In a very large sample, that difference may become statistically significant, but the researcher should still ask whether the difference is practically or scientifically meaningful.
A test of differences therefore requires more information than the p-value alone.
Where appropriate, useful reporting may include:
-
Group means or other suitable summary statistics
-
Magnitude of the difference
-
Test statistic
-
Degrees of freedom where relevant
-
p-value
-
Effect size
-
Confidence interval where appropriate
Statistical significance does not measure the magnitude of an effect or the practical importance of a result, so the interpretation should not stop once the p-value crosses a particular threshold.
-
A test of differences should match the number of groups and the structure of the measurements rather than simply the existence of two variables in the dataset
-
A statistically significant difference may still be very small in practical terms so the magnitude of the difference and effect size should also be considered
-
Repeated testing without a clear plan or adjustment can increase the probability of chance findings
Testing Hypothesis Significance
Testing hypothesis significance is often associated with comparing a p-value with a preselected significance level, such as 0.05 in many research studies.
However, the researcher needs to understand what the p-value actually means.
It does not represent the probability that the null hypothesis is true.
It also does not mean the probability that the result occurred “by chance alone.”
More accurately, a p-value helps assess how compatible the observed data are with a specified statistical model that includes the null hypothesis and the assumptions underlying the analysis.
If the p-value is sufficiently small relative to the selected significance threshold, the observed data are considered less compatible with the null model under the chosen testing framework.
This does not mean that “the alternative hypothesis is 95% likely to be true.”
Similarly, p = 0.049 and p = 0.051 do not represent two completely different realities.
The numerical difference is small even though a strict 0.05 rule may label one “significant” and the other “not significant.”
For this reason, stronger academic interpretation considers the p-value together with effect size, confidence intervals, study design, and measurement quality.
-
The significance level should be defined within the analysis plan and should not be changed after the result is seen merely to obtain a different conclusion
-
A p-value does not directly provide the probability that a hypothesis is true or false
-
Statistical decisions require broader interpretation that includes effect magnitude uncertainty and research design
Choosing Tests for Research Questions
The process of choosing tests for research questions begins with the verbs and structure of the question itself.
A descriptive question such as “What is the level of satisfaction?” may not require a hypothesis test at all; appropriate descriptive statistics may be sufficient.
A question such as “Are there differences?” usually indicates a comparison between groups or measurements.
A question such as “Is there a relationship?” points toward analysis of association or correlation.
A question such as “To what extent do the variables predict...?” suggests an appropriate predictive or regression model.
However, the wording alone is not enough.
Two questions may both ask whether a relationship exists, but one may involve two quantitative variables while the other involves two categorical variables.
They should not automatically be analyzed using the same procedure.
The word “effect” also requires caution.
If the study is cross-sectional and correlational, causal wording may be stronger than what the design can support.
A regression analysis may identify conditional associations or predictive relationships, but that does not automatically make the study causal.
A useful planning matrix might look like this:
This matrix encourages the researcher to begin with the research question rather than opening statistical software and looking for a familiar procedure.
-
Not every research question requires significance testing because descriptive questions may be answered through descriptive statistics alone
-
Terms such as “difference” “relationship” and “prediction” help guide the analysis but variable type completes the decision
-
Causal language should be consistent with the research design rather than with the name of the statistical procedure used
Analyzing Relationships Between Study Variables
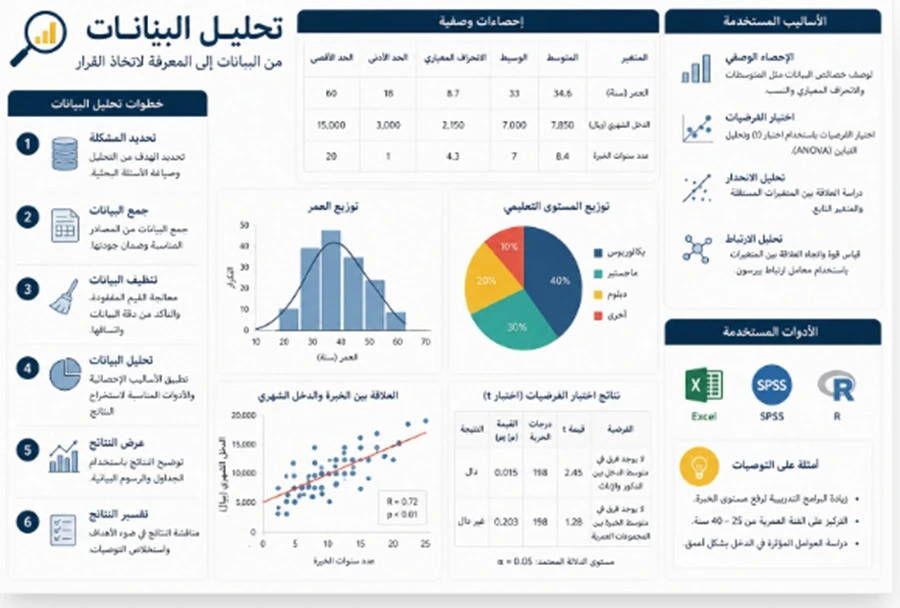
Analyzing relationships between study variables aims to determine whether changes in one variable are associated with changes in another and to describe the direction and strength of that relationship.
However, the appropriate association measure depends on the type and structure of the data.
In some situations, Pearson correlation may be suitable for examining a linear relationship between quantitative variables when its assumptions are adequately met.
In other situations, Spearman correlation or another method may be more appropriate.
When both variables are categorical, entirely different procedures may be used, such as contingency-table analysis and chi-square testing depending on the research question and data structure.
A common mistake is writing that “as X increased, it caused Y to increase” simply because a positive correlation was observed.
Correlation does not establish causation.
Y may influence X.
A third variable may explain the observed relationship.
The study design itself may also be unable to distinguish between different causal explanations.
The strength of the relationship matters as well.
A small p-value does not mean that the relationship is strong.
In a large sample, a weak correlation can still reach statistical significance.
The correlation coefficient itself, its direction, and a confidence interval where available should therefore be considered.
If regression is used, model assumptions and relationships among predictors should also be examined according to the type of regression model.
-
Statistical significance alone does not describe the strength of a relationship so the association coefficient and its direction should also be interpreted
-
A relationship between variables should not be converted into a causal statement unless the study design supports causal inference
-
Variable type and relationship structure determine whether Pearson Spearman or another statistical procedure is appropriate
Interpreting Hypothesis Test Results
Interpreting hypothesis test results requires reporting the statistical finding and then translating it into research meaning without exaggeration.
The first step is identifying the analysis that was used.
The necessary test statistics should then be reported according to the chosen procedure.
The researcher should explain what the finding means in relation to the research question.
If differences are observed between groups, the direction and magnitude of those differences should be described rather than writing only that “significant differences were found.”
If analysis of variance identifies an overall difference among three groups, that result alone does not specify exactly which groups differ from one another. Appropriate post-hoc comparisons may be required according to the analytical design.
If a correlation is observed, the direction and strength should be reported.
In regression analysis, coefficients should be interpreted within the model rather than describing every statistically significant predictor as a cause of the outcome.
It is often useful to distinguish between the results and the discussion according to university requirements.
In the results chapter, the researcher reports what the analysis showed.
In the discussion, the researcher compares the finding with previous studies and theoretical expectations and considers possible reasons for agreement or disagreement.
An important mistake to avoid is describing a non-significant finding as “there is absolutely no relationship.”
A non-significant result means that the data did not provide sufficient statistical evidence for the specified effect under the model and sample used; it is not absolute proof that no difference or relationship exists.
-
Interpretation should describe the direction and magnitude of the difference or relationship rather than relying only on the word significant
-
A non-significant result does not prove complete equality or the total absence of a relationship in the population
-
The language used to interpret the result should remain within the limits of the statistical model and research design
Inferential Statistical Analysis in Research

Inferential statistical analysis in research uses sample data to address questions about populations, relationships, differences, and uncertainty.
This differs from descriptive statistics, which primarily summarize the data currently observed.
Inference therefore requires attention to the sampling method, research design, and analytical assumptions.
If the sample is nonprobability-based or restricted to a specific group, conclusions should be generalized cautiously.
An excellent statistical test cannot repair a weak sampling design.
Sample size also affects statistical power and precision.
A small sample may not provide enough information to detect an effect that actually exists.
A very large sample, on the other hand, can make very small differences statistically significant.
The importance of a finding therefore cannot be separated from effect size, confidence intervals, and scientific context.
Inferential analysis is also not a checklist of procedures that should all be used.
Researchers should select only the analyses necessary for their research design and questions.
-
A statistically sophisticated test cannot compensate for weaknesses in sampling or measurement design
-
Sample size affects both statistical significance and estimation precision so p-values should not be interpreted without considering effect size and uncertainty
-
Inferential analysis should use only the procedures required to answer the research questions rather than the largest possible number of statistical tests
Evaluating Acceptance or Rejection of Hypotheses
The phrase evaluating acceptance or rejection of hypotheses needs careful wording because traditional hypothesis testing does not usually mean that the alternative hypothesis has been permanently “proven” or that the null hypothesis has been conclusively established.
If the result provides sufficient evidence against the null hypothesis under the selected significance level and statistical model, the researcher may state that the null hypothesis is rejected in the context of that test.
If the evidence does not reach the selected threshold, it is usually more accurate to say that the researcher failed to reject the null hypothesis or that “the data did not provide sufficient evidence for the specified difference or relationship” rather than claiming that the null hypothesis was proven true.
Why?
Because insufficient evidence against a hypothesis is not equivalent to proof that the hypothesis is true.
The sample may be too small.
Measurement may be imprecise.
The true effect may be smaller than the study was capable of detecting.
Some university templates use the language of “accepting or rejecting the hypothesis.” In those cases, the required academic template can be followed while the interpretation remains scientifically precise about what the statistical decision actually means.
The direction of the research hypothesis also matters.
If the hypothesis predicts a positive relationship but the analysis finds a statistically significant negative relationship, the hypothesis should not be treated as supported merely because the p-value is small.
Direction is part of the hypothesis.
-
Failure to reject the null hypothesis is not final evidence that it is true
-
Statistical significance should match the predicted direction and form of the hypothesis rather than depending only on a small p-value
-
If a university requires specific acceptance or rejection wording the format can be followed while preserving accurate statistical interpretation
A Statistical Test Selection Map Before Analysis
Researchers can use the following map as an initial guide before running statistical tests:
This checklist supports decision-making but is not a mechanical recipe because some study designs require more complex models that reflect the actual structure of the data.
The Difference Between Parametric and Nonparametric Tests
Parametric tests rely on particular statistical models and assumptions about the data or model parameters.
Nonparametric tests can be useful in different situations and do not rely on exactly the same assumptions.
However, the common statement “if the data are not normal, use a nonparametric test” is often too simplistic.
The decision may also depend on:
-
Type of variable
-
Sample size
-
Shape of the distribution
-
Presence of outliers
-
Independence of observations
-
Research question
-
Properties of the test itself
Some parametric procedures can be relatively robust to certain deviations from normality.
In other cases, the main problem may not involve distributional shape at all but instead the type of data or dependence among observations.
The researcher should therefore diagnose the actual issue before automatically switching to another procedure.
What Is the Difference Between Statistical Significance and Practical Importance?
Statistical significance generally addresses how compatible the observed result is with a null model under the selected testing framework.
Practical importance asks a different question:
Is the size of the difference or relationship meaningful in the actual context of the study?
For example, a difference of half a point on a 100-point scale may produce a very small p-value in an extremely large sample.
Statistically, the analysis may provide evidence that a difference exists.
Practically, however, that difference may still be very limited.
This is why effect size can be important.
Effect-size measures help describe the magnitude of a difference or strength of a relationship in a way that is different from the p-value.
Confidence intervals can also show the range of values that are reasonably compatible with the estimate under the model.
Strong interpretation therefore uses statistical significance as one part of the evidence rather than as the entire conclusion.
Common Errors in Research Hypothesis Testing
Some of the most common mistakes that weaken statistical analysis include:
-
Choosing the test after looking at the p-value
-
Using a test simply because it is commonly used
-
Not knowing the measurement level of the variables
-
Treating two related groups as though they were independent
-
Repeating many two-group tests instead of using an appropriate analysis for several groups
-
Ignoring model assumptions
-
Interpreting correlation as causation
-
Treating p < 0.05 as evidence that the hypothesis is 95% likely to be true
-
Treating p > 0.05 as proof that no effect exists
-
Failing to report effect size when it is important
-
Ignoring confidence intervals
-
Changing the significance threshold after seeing the results
-
Converting a quantitative variable into categories merely to obtain significance
-
Trying several models and reporting only the most favorable one without explanation
-
Ignoring the predicted direction of the hypothesis
-
Writing that “the study proved” something when the design only supports association
-
Conducting many tests without addressing multiple comparisons
-
Failing to match the result tables with the final wording of the hypotheses
Avoiding these errors can improve the credibility of the analysis more than simply increasing the number of statistical procedures.
How Should a Hypothesis Test Result Be Written in a Thesis?
Instead of writing:
“Because the significance level is below 0.05, the hypothesis is correct.”
A stronger result statement should explain the analysis, direction, and magnitude of the finding.
A general example would be:
“The analysis indicated a difference between the two groups in the variable (...) according to the selected statistical test. The p-value was (...), with a difference of (...) and an effect size of (...) where reported. These findings indicate that the observed data provide evidence against the null hypothesis under the conditions of the statistical analysis.”
If the result is not statistically significant:
“The analysis did not provide sufficient statistical evidence of a difference between the two groups at the predefined significance level. Therefore, the null hypothesis was not rejected. This finding should not be interpreted as proof that the two groups are completely identical.”
The actual values and the specific test used should determine the final reporting language.
From the p-Value to the Research Conclusion
A statistical result passes through several levels before it becomes a research conclusion:
Data → Appropriate Test → Statistical Value → Effect Magnitude and Uncertainty → Research Finding → Scientific Discussion
Jumping directly from a p-value to a practical recommendation can exaggerate the result.
For example, observing a relationship between two variables does not automatically mean that changing one variable will cause the other to change.
Recommendations need to consider the research design, previous literature, and study context rather than the statistical table alone.
Why Are Statistical Assumptions Important?
Every statistical model makes assumptions about the data.
The exact assumptions vary by method and may concern:
-
Independence of observations
-
Form of the relationship
-
Distribution of errors
-
Homogeneity of variance
-
Lack of severe multicollinearity among predictors
-
Expected frequencies in some categorical tests
If an important assumption is not adequately met, the test statistic or confidence interval may become less reliable.
For this reason, statistical analysis should not begin directly with the final table of coefficients.
The assumptions relevant to the selected procedure should first be considered and documented where appropriate.
Why Choose Rukn for Research Hypothesis Testing?
Rukn Translation and Educational Services provides educational and research support that includes statistical analysis, interpretation of results, preparation of research tables, and spreadsheet-related work.
The service scope can therefore be adapted to the researcher’s current stage.
The hypotheses may already be written while the appropriate statistical tests remain unclear.
A researcher may be choosing between several procedures because of the type of variables in the dataset.
In another case, the tests may already have been performed, but the researcher needs to review whether the selected procedure was appropriate and whether the written interpretation matches the statistical output.
The researcher may also need a structured table connecting every research question or hypothesis with the corresponding analysis.
The value does not lie in producing the largest possible number of statistical tables.
The value lies in making sure that every test has a clear reason and directly addresses a research question.
No responsible service should guarantee that a hypothesis will produce statistical significance.
The test should also not be changed and observations should not be deleted simply to obtain a preferred result.
The researcher remains responsible for data integrity, research design, and final academic decisions.
Steps for Testing Research Hypotheses
The work can be organized as follows:
-
Receive the research plan, research questions, and hypotheses.
-
Review the wording of each hypothesis and make sure it is statistically testable.
-
Identify the variables connected to every hypothesis.
-
Determine the measurement level of each variable and how scale scores are constructed.
-
Identify the number of groups and whether measurements are independent or related.
-
Review the dataset and confirm that it is ready for statistical analysis.
-
Select a preliminary statistical test for each hypothesis.
-
Check the assumptions of the selected test in relation to the data and design.
-
Use an appropriate alternative when the initial procedure is not suitable.
-
Conduct the analysis and preserve the necessary statistical indicators.
-
Review the p-value according to the predefined significance level.
-
Calculate or examine effect size and confidence intervals where appropriate.
-
Identify the direction of the difference or relationship rather than relying on significance alone.
-
Write the hypothesis decision accurately without claiming absolute proof or acceptance.
-
Organize results into tables connected to the relevant research questions and hypotheses.
-
Review the interpretation to make sure it does not exceed what the research design supports.
-
Match all numbers between tables and written text before including the results in the final thesis.
Using this process allows the researcher to trace every conclusion back to the hypothesis, statistical test, and data that produced it.
Research Hypothesis Testing and Inferential Analysis Prices
There is no single fixed price for research hypothesis testing and statistical test selection because the analytical workload varies according to the study design.
Factors that can affect the scope include:
-
Number of hypotheses
-
Number of variables
-
Variable types
-
Number of groups
-
Presence of repeated measurements
-
Sample size
-
Readiness of the dataset
-
Number of required statistical tests
-
Need to evaluate multiple assumptions
-
Need for post-hoc tests after analysis of variance
-
Presence of regression models
-
Need to analyze relationships differences or prediction
-
Need to calculate effect sizes
-
Number of result tables
-
Need for written interpretation
-
Supervisor comments
-
Submission deadline
A study containing two simple hypotheses and a clean dataset is different from a research project containing several variables, groups, interrelated hypotheses, and multiple statistical models.
For this reason, it is better to provide the research plan, research questions, hypotheses, dataset, and variable definitions so the actual analysis scope can be determined before pricing.
Frequently Asked Questions
How do I know which statistical test is appropriate for my hypothesis?
Begin by identifying the type of research question, the dependent and independent variables, the number of groups, and whether observations are independent or related. The assumptions of the candidate analysis should then be reviewed before selecting the final test.
Does p < 0.05 mean the research hypothesis is true?
No. A p-value does not represent the probability that the research hypothesis is true. It is one component of evaluating the observed data under a specified statistical model and should be interpreted together with effect size, confidence intervals, and study design.
If p > 0.05, should I accept the null hypothesis?
It is generally more accurate to say that the null hypothesis was not rejected or that the study did not find sufficient statistical evidence for the specified effect or difference rather than claiming that the null hypothesis was proven true.
Should Pearson correlation be used for every relationship between two variables?
No. The appropriate measure depends on the measurement level of the variables, the form of the relationship, the data characteristics, and the assumptions of the procedure. In some situations, Spearman correlation or another analysis may be more suitable.
What should I send when requesting research hypothesis testing?
Send the research plan, research questions, hypotheses, variable definitions, dataset, scale-scoring method, and any supervisor comments or specific university requirements.
Conclusion
Successful research hypothesis testing and choosing the right statistical test is not measured by the number of hypotheses that produce a value below 0.05.
Strong analysis begins with a clearly stated hypothesis.
The variables are then identified.
The researcher determines the type of each variable, the number of groups, and the structure of the measurements.
The statistical test is then selected based on the research design.
Its assumptions are reviewed.
The significance value is interpreted together with the magnitude of the difference, strength of the relationship, effect size, and confidence interval where appropriate.
Finally, the statistical decision is reported using language that does not claim more than the data can support.
The goal is not to make every hypothesis “accepted.”
The goal is to test each hypothesis using the correct method and report honestly what the data actually show.
If you already have research hypotheses, study questions, and a dataset ready for analysis but are unsure which tests to use or how to interpret the results, prepare the research plan, variable definitions, dataset, and any supervisor comments, then contact Rukn Translation and Educational Services to determine whether you need statistical test selection only, complete inferential analysis, hypothesis review, or interpretation and preparation of final research tables before including them in the thesis.
Need Help?
Contact us directly via WhatsApp and we will reply as soon as possible.
More Articles
Cronbach's Alpha Reliability Testing and Result Interpretation
Cronbach’s alpha reliability testing with internal consistency analysis, item review, result interpretation, and clear limits for use in academic research.
Read Article → Statistical AnalysisSurvey Data Coding and Preparation for Statistical Analysis
Survey data coding and preparation for statistical analysis, including variable definitions, missing data, reverse-coded items, data cleaning, and organized research datasets.
Read Article → Research Project AnalysisStatistical Survey Analysis and Results Interpretation for Researchers
Statistical survey analysis with data cleaning, test selection, table preparation, and clear interpretation of results linked directly to research questions and hypotheses.
Read Article →