
Statistical Survey Analysis and Results Interpretation for Researchers
Statistical survey analysis with data cleaning, test selection, table preparation, and clear interpretation of results linked directly to research questions and hypotheses.

Statistical Survey Analysis and Results Interpretation for Researchers
Statistical survey analysis with results interpretation for researchers requires much more than entering responses into statistical software and generating a set of tables. A correct result begins with understanding the research question, the nature of the variables, the way responses were coded, and the quality of the dataset before selecting the appropriate statistical procedure. A researcher may obtain a mathematically correct statistical value but interpret it in a way that is not justified by the study design, choose a test that does not match the data type, or overlook reverse-coded items and missing values. For this reason, a complete analysis begins by reviewing the dataset, questionnaire, and research plan, then moves to descriptive statistics and appropriate inferential tests. The findings are then interpreted in clear language that connects every table to the research question or hypothesis it addresses without changing the numbers or exaggerating what they mean.
Statistical Survey Analysis

Statistical survey analysis begins before running any command inside a statistical program because the first step is understanding the structure of the questionnaire and how participants’ responses were transformed into analyzable variables.
It should be clear what each column in the dataset represents.
Does the column represent one independent question?
Do several items combine to form one dimension or scale?
Are there demographic variables such as age, gender, academic level, or specialization?
Are there reverse-worded items that need to be recoded before calculating a total or dimension score?
If the analysis begins without this map, a researcher may calculate the mean of a dimension incorrectly or combine items that were never intended to be analyzed together.
The coding system should then be reviewed.
For example, on a five-point scale, it should be clear whether “strongly agree” always receives the highest value or whether some items are worded in the opposite direction and therefore require reverse coding.
For nominal questions, the number assigned to a category is only a code. Giving one category the value 3 and another the value 2 does not mean the first category is quantitatively “higher” than the second.
The data themselves should then be checked.
Are there missing responses?
Are any values outside the permitted range?
Did a participant receive or enter the value 6 for an item whose available responses range from 1 to 5 because of a data-entry error?
Are there duplicated records?
These problems should be addressed before statistical testing because a beautifully formatted table based on unclean data can still represent incorrect input.
-
Statistical analysis should begin with a clear map of variables dimensions and coding before any result is generated
-
Reverse-coded items missing values and out-of-range responses require documented handling rather than being ignored
-
A numerical code assigned to a category does not change the statistical nature of the variable or automatically make a nominal variable quantitative
Analyzing Saudi Survey Data
Analyzing Saudi survey data requires consideration of the study design, academic discipline, and university requirements rather than applying the same statistical test to every research project that uses a questionnaire.
A questionnaire is a data-collection instrument, but it does not determine the analysis by itself.
Two studies may both use Likert-type items, yet the first may aim only to describe participants’ attitudes, the second may test differences between groups, and the third may examine the relationship between two variables.
Each of these studies requires a different analysis plan.
Before selecting any statistical method, the researcher should return to the research questions or hypotheses.
A question beginning with “What is the level of...” differs from “Are there significant differences...” or “Is there a relationship...” or “To what extent can one variable predict another?”
The nature of the variables and the method used to create scores should then be identified.
Sample size, sampling method, and study design also affect the limits of interpretation.
If a convenience or purposive sample was used, the results should not automatically be treated as representative of all university students in Saudi Arabia without discussing the limitations of generalization.
The researcher should also distinguish between analysis that describes the sample and inferential analysis that tests a difference, relationship, or statistical model.
The goal is not to use the largest possible number of tests.
The goal is to choose the smallest set of analyses that can answer the research questions clearly and appropriately.
-
The analysis plan should be built from the research questions hypotheses and variable types rather than from the name of the statistical software being used
-
Findings from a specific sample should be interpreted within the limits of the sampling method and target population rather than generalized beyond what the design supports
-
A larger number of statistical tests does not mean a stronger analysis when those tests do not directly serve the research questions
Interpreting Survey Results
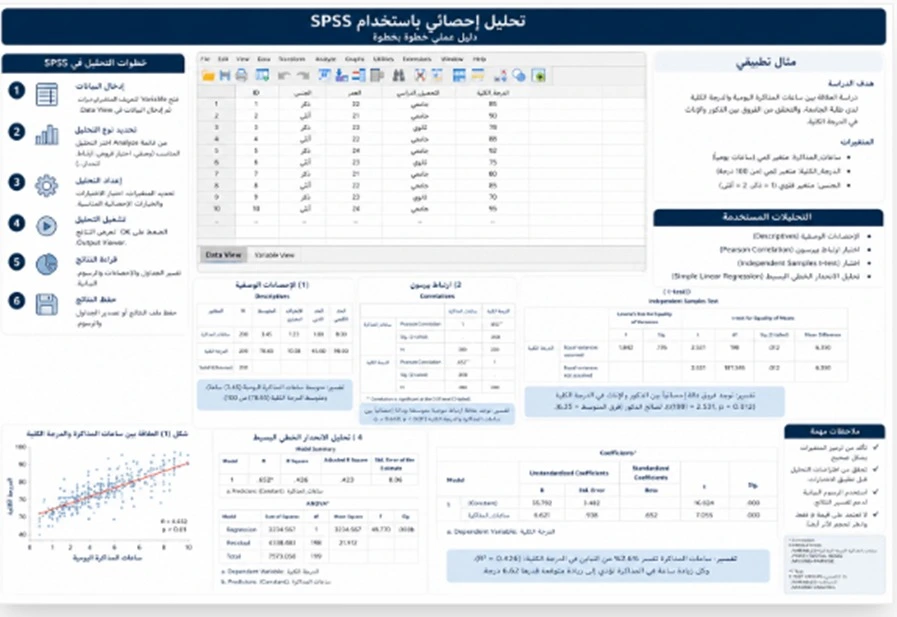
Interpreting survey results is the stage that transforms statistical output into a research answer that both the researcher and the reader can understand.
If a dimension has a particular mean score, simply copying the number from the table is not enough.
The researcher needs to understand what that mean represents according to the way the scale was constructed.
At the same time, labels such as “high,” “moderate,” or “low” should not be assigned unless the study uses a clear and justified criterion for interpreting those scores.
In inferential analysis, a statistically significant result does not automatically mean that the finding is practically important or that the effect is large.
A very small difference may reach statistical significance in a large sample.
For this reason, effect size, the magnitude of the difference, and the research context may also need to be considered where appropriate for the type of analysis.
Conversely, a non-significant result does not necessarily prove that there is absolutely no difference in reality.
It means that, under the data, model, assumptions, and selected significance level, the analysis did not provide sufficient statistical evidence for the tested difference or relationship.
Interpretation must also respect the research design.
If the study is correlational, an association between two variables does not automatically justify claiming that one causes the other.
-
Interpreting a statistical value begins with understanding the scale and how its score was calculated rather than looking at the mean alone
-
Statistical significance does not necessarily mean substantial practical importance so effect size or magnitude should be considered where relevant
-
A correlational relationship should not be converted into a causal conclusion when the study design does not establish cause and effect
Quantitative Research Data Analysis
Quantitative research data analysis depends on moving systematically from raw data to findings that answer the research questions.
The first stage usually involves reviewing and cleaning the dataset.
The next stage is describing the sample and the main study variables.
Inferential tests or statistical models are then applied where the research questions require them.
For categorical variables, frequencies and percentages are often useful for describing the number of participants in each category.
For quantitative variables, means and standard deviations may be appropriate, while other measures may be more suitable depending on the distribution and type of data.
However, choosing the mean should not be automatic simply because the dataset contains numbers.
Measurement level, distribution shape, and the purpose of the description all matter.
In inferential analysis, the statistical test needs a clear justification.
Is the study comparing two groups?
More than two groups?
Examining a relationship?
Testing prediction?
Comparing measurements before and after an intervention?
Each design creates different analytical options.
Where relevant, the assumptions of the selected test should also be checked rather than running the procedure and accepting the output without evaluation.
Some analyses have assumptions involving data distribution, independence of observations, homogeneity, or other characteristics. When those assumptions are not adequately met, another analytical approach may need to be considered.
-
Quantitative analysis should move from data cleaning to descriptive analysis and then to appropriate inferential testing rather than jumping directly to hypothesis tests
-
Descriptive statistics should be selected according to the type and distribution of the variable instead of treating the mean as the default for every dataset
-
Every inferential procedure needs methodological justification and an assessment of whether it is appropriate for the study design and available data
Extracting Survey Tables
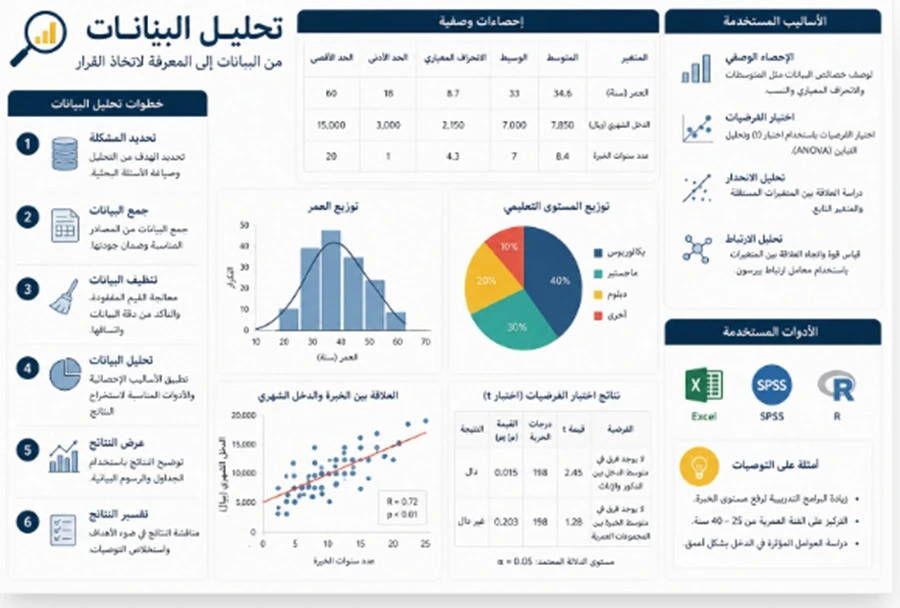
The purpose of extracting survey tables is not to generate as many tables as possible but to display the information the reader needs with as little unnecessary duplication as possible.
The process may begin with tables describing participant characteristics when those characteristics are relevant to the sample description.
Examples may include academic specialization, study level, or age group where required by the study.
Tables summarizing dimensions or study variables can then be prepared.
If one dimension contains ten items, the researcher may need a detailed item-level table in a particular section, but this does not justify repeating the same values in several additional tables without a clear purpose.
Inferential-analysis tables should contain the indicators necessary for understanding the result.
The specific columns depend on the type of test and on the university or disciplinary standards used for reporting.
Table titles should accurately describe their content.
Figures mentioned in the written interpretation must also match the figures in the table.
If the analysis is repeated after excluding a case or correcting a coding error, both the narrative text and tables need to be updated together.
A common mistake is copying the complete raw output from a statistical program directly into the thesis.
Software output can contain diagnostic or technical information useful to the analyst but unnecessary for the final reader.
-
A good table presents the information needed to answer the research question without repeating the same values across multiple formats
-
The table title content and written explanation should remain fully consistent after the final analysis
-
Raw software output should be organized and academically selected rather than copied automatically into the research document
Analyzing Participant Responses
Analyzing participant responses requires treating each response as data produced within a particular collection context rather than as isolated numbers.
Before scores are calculated, missing responses should be examined.
Did a participant leave only one item unanswered?
Did they leave half of the questionnaire incomplete?
Is there a repeated pattern in the missing data?
The decision to delete a case, retain it, or handle missing values in another way should not be random. It should fit the analysis plan and the nature of the missingness.
Unusual or potentially problematic response patterns may also deserve review.
For example, one participant may have selected exactly the same response option for every item.
That alone does not prove the response is invalid because the pattern may genuinely reflect the participant’s answers.
Data should therefore not be removed merely because they look unusual.
A clear and defensible criterion is needed.
When questionnaires contain multiple items representing the same dimension, the dimension score should be calculated according to the approved scoring method for the instrument.
A researcher should not choose the three items that produce the most favorable result after seeing the data and remove the rest without methodological justification.
Any excluded cases should also be documented because the final number of participants included in the analysis should be understandable to the reader.
-
Missing values require a clear handling strategy rather than automatic deletion of every incomplete response
-
An unusual response should not be excluded simply because it differs from the rest unless there is a justified research-based criterion
-
Dimension scores should be calculated according to the instrument design and analysis plan rather than changing the included items after seeing the desired result
Descriptive Analysis of a Questionnaire

Descriptive analysis of a questionnaire provides the foundation that helps the researcher understand the dataset before moving to more advanced statistical testing.
If the researcher does not know the sample distribution, variable averages, or degree of variability, they may interpret an inferential test without understanding the basic data pattern.
For categorical data, frequencies and percentages are commonly used to describe the number of participants in each category.
For quantitative data, measures of central tendency and variability such as the mean and standard deviation may be appropriate, while the median and interquartile range may be more suitable in other situations.
Minimum and maximum values can also be examined when useful for identifying values that should not appear within the permitted range.
Graphs may be used when they provide insight that is not easily obtained from a table.
However, not every variable requires a graph.
For multi-item measures, the dimensions can be described after confirming that their scores have been calculated correctly.
Researchers should also be cautious about converting every mean into a verbal judgment such as “excellent,” “weak,” or “high” without a defined criterion.
Any verbal interpretation needs a clear basis in the scale or study methodology.
-
Descriptive statistics provide an initial picture of the sample and study variables before inferential testing begins
-
The mean and standard deviation are not automatically the best choice for every dataset so measurement type and distribution should be considered
-
Verbal classifications of means require predefined criteria rather than boundaries invented after the results become visible
Analyzing Study Variables
Analyzing study variables begins with a clear definition of each variable and its role in the research.
Is it a dependent variable?
An independent variable?
A control variable?
A descriptive characteristic of the sample?
Or a dimension within a broader scale?
This role influences how the variable is included in the analysis.
The measurement level and coding method should then be identified.
Age recorded in actual years is different from age divided into categories.
Collecting a variable continuously and then converting it into categories later can result in the loss of information, so such a decision should have a research-based reason.
The relationships the researcher wants to examine should then be reviewed.
If the question asks about differences among three groups, the analysis differs from a question examining a relationship between two quantitative scores.
If several variables are entered into one statistical model, the model should be connected to a clear research question or hypothesis rather than including variables simply because they happen to exist in the dataset.
Potential overlap among variables should also be considered.
Two variables may represent highly similar concepts, which may require examination before interpreting the effect of each one independently.
-
The role of each variable in the study should be identified before the analysis because the variable name alone is not enough to select a statistical test
-
Transforming variables or dividing them into categories requires justification because some transformations can remove information contained in the original data
-
Statistical models should be built to answer a specific hypothesis or research question rather than including the largest possible number of available variables
Reading Statistical Analysis Results
Reading statistical analysis results is a different skill from running statistical software because the researcher needs to understand what the values mean and, equally importantly, what they do not mean.
The first step is identifying the question the statistical test was designed to answer.
If the researcher performs a test of differences, it should be clear which groups are being compared and which outcome variable is involved.
The test statistic, degrees of freedom, significance level, and other required indicators should then be interpreted according to the analysis.
However, the interpretation should not be built around one isolated value.
A probability value can contribute to a statistical decision under the selected model, but it does not measure the magnitude of the difference or its practical importance.
For this reason, effect size, confidence intervals, or the actual magnitude of the difference may also need to be examined depending on the test and the research question.
Similarly, the statement “there is no statistically significant difference” does not mean that two groups are completely identical.
The statement “there is a relationship” also does not explain the direction or strength of that relationship by itself.
In regression models, the presence of a statistically significant predictor does not automatically prove that the predictor causes the outcome.
The final interpretation must remain consistent with the design of the study.
It is also important for the researcher to understand the result personally.
If a supervisor or examiner asks about the meaning of a coefficient or table, the researcher should be able to explain it in their own words instead of reading a prepared interpretation whose logic they do not understand.
-
Reading statistical results begins with the question the test was designed to answer rather than searching the output for a significant value
-
Significance levels effect sizes and confidence intervals are different indicators and each contributes different information about the finding
-
The final interpretation should remain within the limits of the study design and should not automatically turn association or statistical prediction into causation
Survey Analysis Services for Researchers
A responsible survey analysis service for researchers should connect the statistical work to the research plan rather than handing the student a large output file without explanation.
Before analysis begins, important information should be available, such as the research title, objectives, questions or hypotheses, questionnaire, dataset, and response-coding system.
If the researcher is using a published instrument, it is also useful to know the approved scoring method.
The required analysis scope should then be defined.
Is the researcher requesting data cleaning only?
Is descriptive analysis needed?
Are there hypotheses requiring inferential testing?
Does the researcher need tables prepared for inclusion in the thesis?
Does the researcher need the results explained so they understand how to present and discuss them?
The real value of the service is not producing a “statistically significant result.”
A non-significant result can be completely correct and academically important.
Professional analysis should therefore not change tests merely to obtain a smaller probability value or exclude participants without justification in order to alter the findings.
Missing responses should never be invented, and data should never be modified to create a desired outcome.
The researcher remains responsible for the original data, the integrity of data collection, and the scientific decisions adopted in the final thesis.
-
Statistical analysis should begin with the research questions instrument and dataset rather than running a generic series of tests on every available variable
-
A non-significant finding is not a failure and the analysis method should not be changed merely to obtain statistical significance
-
The researcher should receive an interpretation they understand and can explain rather than only a file containing unexplained statistical output
What Is the Difference Between Descriptive and Inferential Statistics?
The distinction matters because each type answers a different question.
Descriptive statistics should not be treated as an unimportant preliminary stage to be passed through quickly. They allow the researcher to understand the structure of the data before moving into inferential analysis.
What Should Be Reviewed Before Statistical Analysis Begins?
Before completing the final analysis, it is useful to confirm several elements:
-
The final version of the questionnaire is the same version that was actually distributed.
-
The coding of all response options is known.
-
Reverse-coded items have been identified.
-
Demographic variables are clearly defined.
-
Research questions and hypotheses are in their final form.
-
The total number of responses is known.
-
Excluded cases have a clear reason.
-
Missing values have been identified.
-
The dimensions and scoring method are known.
-
The type of each variable has been determined.
-
Proposed statistical tests are connected to the research questions.
-
University requirements for presenting tables are known where a specific format exists.
A problem discovered at this stage is much easier to correct than one found after the tables have been completed and the results chapter has already been written.
How Is the Appropriate Statistical Test Selected?
There is no single statistical test that is “best” for all survey research.
Selection depends on several questions:
What is the research question?
Is it about description, difference, relationship, prediction, or comparison before and after an intervention?
What type of variables are involved?
Are they nominal, ordinal, quantitative, or composite scores?
How many groups are being compared?
One group, two groups, or more than two?
Are the measurements independent or related?
Are they different participants or the same participants measured before and after?
Are the assumptions of the proposed test appropriate?
And is there an alternative method if those assumptions are not sufficiently met?
What is the size and quality of the dataset?
Very small samples or substantial missing data can limit some analyses.
For this reason, test selection should begin before the result is examined.
Running several tests and keeping only the one that produces the preferred finding weakens the credibility of the analysis.
Common Errors in Survey Analysis
Some of the most important mistakes that can affect the result or its interpretation include:
-
Failing to reverse-code negatively worded items.
-
Entering a value outside the permitted scale range.
-
Combining questions from different dimensions without a theoretical basis.
-
Removing responses that do not support the expected result without a predefined criterion.
-
Selecting a statistical test because it is popular rather than appropriate.
-
Running many tests without clear hypotheses.
-
Treating every statistically significant value as practically important.
-
Interpreting non-significance as proof that absolutely no difference exists.
-
Converting correlation into causation.
-
Writing that “the study proved” something when the research design does not justify that level of certainty.
-
Ignoring missing values.
-
Copying all statistical software output into the thesis.
-
Allowing figures in the text to differ from the corresponding table.
-
Writing an interpretation that does not match the direction of the coefficient.
-
Changing the analysis plan only because the original result was not statistically significant.
Correcting these issues is more important than increasing the number of statistical tests or tables.
How Should Results Tables Be Interpreted in a Thesis?
The table should present the data, while the written text should explain the main message that the reader needs to understand from it.
The researcher does not need to repeat every value shown in the table in the paragraph that follows.
It is usually better to identify the important result and mention only the values necessary to understand it.
The discussion chapter can then move from what did the result show? to how can the result be understood?
This is where previous studies and the theoretical framework become relevant.
However, the distinction between result and interpretation should remain clear according to the university’s thesis structure.
A previous study does not change the researcher’s finding.
It helps the researcher compare and interpret the finding.
If the result differs from previous literature, the difference should not be hidden. It may itself become an important point for discussion if treated carefully and appropriately.
Is Statistical Significance the Most Important Result?
No.
Statistical significance is one tool for answering part of the research question, but by itself it does not provide all the information needed to evaluate a finding.
Depending on the analysis, researchers may also need to consider:
-
Magnitude of the difference.
-
Direction of the relationship.
-
Strength of the relationship.
-
Effect size where appropriate.
-
Confidence interval when required or useful.
-
Sample size.
-
Measurement quality.
-
Study design.
-
Limits of generalization.
A finding may be statistically significant but have only a small effect.
Another finding may contain an academically meaningful pattern that deserves careful interpretation even if it does not reach a predefined significance threshold.
Strong analysis therefore does not become a search for the words “significant” or “not significant” alone.
How Are Survey Results Connected to Research Questions?
One useful approach is to build a map before writing the results:
This map prevents the appearance of a table that has no clear research question and reduces the risk of leaving one research question without analysis.
It also helps the researcher during the defense because each finding can be connected directly to the question it was designed to answer.
Why Choose Rukn for Statistical Survey Analysis?
Rukn Translation and Educational Services provides educational services related to spreadsheets, data organization, statistical analysis, and presenting results in an understandable format, allowing the service scope to be adapted to the current stage of the research.
A researcher may have a raw dataset that requires cleaning and coding.
Another may already have organized data but need statistical analyses selected according to the research questions.
In another case, the tables may already exist while the researcher needs the written interpretation reviewed to confirm that it accurately reflects the reported values.
The researcher may also need tables organized for clearer presentation inside the thesis.
The important advantage is treating statistical analysis as part of the research process rather than as a task separated from the research problem, objectives, questions, and instrument.
No responsible service should promise statistically significant findings or a particular outcome before the data are analyzed.
Responses should also never be invented or altered to make them consistent with a prior expectation.
Steps for Statistical Survey Analysis
The work can be organized through clear stages:
-
Receive the research plan, questionnaire, and dataset to understand the purpose of the analysis.
-
Review the research questions and hypotheses and identify what each one requires.
-
Create a variable and coding dictionary explaining the meaning of every column and value.
-
Clean the dataset and check missing values, duplicates, and invalid entries.
-
Reverse-code relevant items when required by the instrument.
-
Calculate dimension or scale scores according to the approved scoring method.
-
Conduct descriptive analysis to understand the sample and variables.
-
Check assumptions of the required analyses where relevant.
-
Run the appropriate inferential tests for the research questions.
-
Organize the tables so they contain necessary indicators without unnecessary software output.
-
Interpret the findings in language directly connected to the research questions and hypotheses.
-
Review the figures and written interpretation to ensure complete agreement between text and tables.
-
Identify the limits of each conclusion and avoid exceeding what the study design supports.
-
Prepare a researcher-friendly version that helps the researcher explain the findings in the thesis or defense.
Using this process ensures that every test has a clear reason, every table is linked to a research question, and every interpretation can be traced back to an actual value in the dataset.
Statistical Survey Analysis Prices
There is no single fixed price for statistical survey analysis because the scope depends on the study structure, dataset condition, and type of analysis required.
Factors that may affect the scope include:
-
Number of participants.
-
Number of questionnaire items.
-
Number of dimensions and variables.
-
Quality and organization of the dataset.
-
Presence of reverse-coded items.
-
Amount of missing data.
-
Number of research questions and hypotheses.
-
Type of statistical analyses required.
-
Whether descriptive analysis alone or both descriptive and inferential analysis are needed.
-
Number of different measures or scales.
-
Number of required tables.
-
Need for written interpretation of findings.
-
Supervisor revisions.
-
Need to review the results chapter.
-
Submission deadline.
A clean and well-organized dataset with a clear analysis plan is different from a file that requires extensive cleaning, recoding, and reconstruction of scale scores.
Likewise, a simple descriptive study differs from one containing several hypotheses, relationships, predictors, and statistical models.
For this reason, it is better to provide the questionnaire, dataset, research questions or hypotheses, and the current methodology chapter so the actual analysis scope can be identified before pricing.
Frequently Asked Questions
Can the questionnaire be analyzed immediately after data collection closes?
Analysis can begin once data collection is complete, but the dataset should first be checked, cleaned, and coded before the final statistical tests are run so data-entry problems do not carry into the findings.
Does every questionnaire-based study require inferential statistics?
No. The type of analysis depends on the research questions and study design. Some studies are primarily descriptive, while others require tests of differences, relationships, prediction, or additional statistical models.
Does a non-significant result mean the research failed?
No. A non-significant result is still a research finding that should be interpreted within the study design and available data. The analysis should not be changed merely to try to obtain significance.
Can the results be interpreted without referring to the research questions?
Doing so weakens the analysis. Each result should ideally be linked to a research question or hypothesis and interpreted within the variables and methodology used so the tables do not become isolated numbers.
What should I send when requesting survey analysis?
Send the final questionnaire, dataset, research title, objectives, research questions or hypotheses, variable definitions, response-coding method, and any supervisor comments or specific university requirements.
Conclusion
Successful statistical survey analysis and results interpretation for researchers is not measured by the number of statistical tests performed or by how many significant findings appear.
Strong analysis begins with a valid research question.
The variables are then defined, responses are coded, and the data are cleaned.
The sample and study dimensions are described appropriately.
After that, statistical tests are selected because they genuinely answer the research questions and hypotheses.
Finally, statistical values are converted into a clear interpretation that respects the study design and does not give the numbers more meaning than the evidence allows.
The objective is not to obtain a particular result.
The objective is to reach the result that genuinely reflects the data and then explain it in a way the researcher can understand, write about, and defend before a supervisor or examination committee.
If you already have a distributed questionnaire and a dataset ready for analysis, prepare the data file, final version of the instrument, research questions or hypotheses, and any supervisor comments, then contact Rukn Translation and Educational Services to determine whether you need data cleaning, descriptive analysis, hypothesis testing, table preparation, or review and interpretation of findings before incorporating them into the thesis.
Need Help?
Contact us directly via WhatsApp and we will reply as soon as possible.
More Articles
Research Hypothesis Testing and Choosing the Right Statistical Test
Research hypothesis testing and statistical test selection based on variable type and study design, with accurate interpretation of significance, effect size, and results.
Read Article → Data ProcessingCronbach's Alpha Reliability Testing and Result Interpretation
Cronbach’s alpha reliability testing with internal consistency analysis, item review, result interpretation, and clear limits for use in academic research.
Read Article → Statistical AnalysisSurvey Data Coding and Preparation for Statistical Analysis
Survey data coding and preparation for statistical analysis, including variable definitions, missing data, reverse-coded items, data cleaning, and organized research datasets.
Read Article →